TimescaleDB vs QuestDB: 2026 Benchmark Results
Compare QuestDB and TimescaleDB with up-to-date performance benchmarks and architectural comparisons.



TimescaleDB and QuestDB are both open-source time-series databases. TimescaleDB is a PostgreSQL extension that adds time-series storage and functions to a database many teams already run. QuestDB is a standalone engine built for ingestion throughput and query latency.
TimescaleDB is the right choice when you already run PostgreSQL and want time series inside it. You keep your drivers and tooling and get hypertables and continuous aggregates on top. QuestDB is for the workloads PostgreSQL was never built for. It ingests millions of rows a second and serves the latest state in milliseconds with years of history behind it, for the cases where a single lost record has consequences.
This article runs both through the same TSBS benchmark on the same machine, TimescaleDB 2.29.1 against QuestDB 9.3.3, publishes every number, and then looks at the architectural differences behind the results.
These benchmarks predate QWP, the binary protocol we shipped in QuestDB 10.0 in August 2026. Ingestion here runs over InfluxDB Line Protocol, a text format the server parses row by row. QWP sends binary columns instead, up to 3.6x faster over a network, and it streams reads back as Arrow. Read the QuestDB figures below as a floor.
Introducing TimescaleDB & QuestDB
DB-Engines classifies them like this:
| Feature | QuestDB | TimescaleDB |
|---|---|---|
| Primary database model | Time Series DBMS | Time Series DBMS |
| Implementation language | Java (zero-GC), C++, Rust | C |
| SQL? | Yes | Yes |
| APIs | QWP, ILP, HTTP, PGWire, JDBC | JDBC, ODBC, C lib |
TimescaleDB is a time series database built atop PostgreSQL. It's provided under two licenses: Apache 2.0 and the proprietary Timescale License. It's an extension of PostgreSQL, rather than a standalone database. If you already run PostgreSQL, it is the familiar way in.
Want to see a QuestDB comparison vs. InfluxDB? Read the article
QuestDB is an open-source time series database licensed under Apache License 2.0. It is a standalone engine rather than an extension, written for ingestion throughput and query latency, and it stores historical data as Parquet so the data stays readable without QuestDB. Queries are standard SQL with time-series extensions.
Performance benchmarks
Ingestion first, then queries. We use the Time Series Benchmark Suite (TSBS) for both. TSBS was created by Timescale and has seen no real development upstream since 2023, so we maintain our own fork.
Ingestion benchmark results
Hardware:
-
AWS EC2 r8a.8xlarge instance with 32 vCPU and 256 GB RAM (AMD EPYC)
-
GP3 EBS storage configured for 20,000 IOPS and 1 GB/s throughput
And on the software side:
-
Ubuntu 22.04
-
TimescaleDB 2.29.1 on PostgreSQL 17.10, tuned to the hardware with
timescaledb-tune(roughly 19 settings, including ~60 GB of shared buffers) -
QuestDB 9.3.3 with the out-of-the-box configuration
Measured: TimescaleDB 2.29.1, benchmarked August 2026. QuestDB 9.3.3, on the same r8a.8xlarge instance. New benchmarks on QuestDB 10.0 are coming.
Core allocation: the TSBS client and the database run on the same instance with no CPU pinning.
Query statistic: each figure is the median latency within a run, averaged over 3 runs, with a warm query cache.
The benchmark compares ingestion speed between QuestDB and TimescaleDB using the TSBS cpu-only use case. Data is sent via 32 concurrent connections. We test four scale factors representing different cardinality levels. We start at 1,000 hosts. Smaller datasets finish in under a second on the faster engines, where setup cost dominates and the result stops measuring throughput.
Generating and loading the QuestDB side, changing --scale for each level:
$ ./tsbs_generate_data --use-case="cpu-only" --seed=123 --scale=4000 \--timestamp-start="2016-01-01T00:00:00Z" \--timestamp-end="2016-01-03T00:00:00Z" \--log-interval="10s" --format="questdb" > /tmp/questdb_data$ ./tsbs_load_questdb --file=/tmp/questdb_data --workers=32
TimescaleDB is loaded from the same seed with --format="timescaledb" and
tsbs_load_timescaledb, also with 32 workers.
↑ Higher is better
QuestDB peak rows/sec, at 100K hosts
TimescaleDB peak rows/sec, at 1K hosts
| Scale (hosts) | QuestDB (rows/sec) | TimescaleDB (rows/sec) | QuestDB Advantage |
|---|---|---|---|
| 1,000 | 7,770,000 | 1,310,649 | 5.9x faster |
| 4,000 | 7,960,000 | 1,242,810 | 6.4x faster |
| 100,000 | 8,590,000 | 1,075,178 | 8.0x faster |
| 1,000,000 | 7,140,000 | 904,424 | 7.9x faster |
QuestDB holds between 7.1 and 8.6 million rows per second from 1,000 hosts all the way to 1 million, which is the property that matters here: adding series does not cost QuestDB anything structural.
TimescaleDB peaks at 1.31 million rows per second for 1,000 hosts, then degrades
as cardinality rises, dropping to 904K rows/sec at 1M hosts. It is also the only
engine here tuned to the hardware: timescaledb-tune sets roughly 19 parameters
during setup, while QuestDB runs its out-of-the-box configuration. The comparison
below is therefore a tuned TimescaleDB against an untuned QuestDB.
The row-based write path is the reason, and the architecture section below goes into it.
Query benchmark results
As part of the standard TSBS benchmark, we test several types of popular time series queries: single-groupby (aggregating metrics for specific hosts over time ranges), double-groupby (aggregating across all hosts), cpu-max-all, the high-cpu threshold scans, lastpoint and top-N.
All query benchmarks run with a single worker against the 4,000-host dataset (69,120,000 rows), 1,000 queries per type:
$ ./tsbs_generate_queries --use-case="devops" --seed=123 --scale=4000 \--timestamp-start="2016-01-01T00:00:00Z" \--timestamp-end="2016-01-03T00:00:00Z" \--queries=1000 --query-type="single-groupby-1-1-1" \--format="questdb" > /tmp/questdb_query$ ./tsbs_run_queries_questdb --file=/tmp/questdb_query --workers=1
TimescaleDB runs the same generated queries through tsbs_run_queries_timescaledb.
Single-Groupby Queries
These queries aggregate CPU metrics for random hosts over specified time ranges.
Query names encode metrics, hosts and hours: 5-8-1 is five metrics, eight hosts, one hour. Every query on this page is described in the appendix.
↓ Lower is better
Query format: metrics-hosts-hours · median of 3 runs, warm cache
QuestDB, single-groupby-5-1-12
TimescaleDB, single-groupby-5-1-12
| Query | QuestDB (median) | TimescaleDB (median) | QuestDB Advantage |
|---|---|---|---|
| single-groupby-1-1-1 | 0.41 ms | 0.54 ms | 1.3x faster |
| single-groupby-1-1-12 | 1.43 ms | 3.49 ms | 2.4x faster |
| single-groupby-1-8-1 | 0.91 ms | 2.39 ms | 2.6x faster |
| single-groupby-5-1-1 | 0.60 ms | 0.57 ms | TimescaleDB 1.1x |
| single-groupby-5-1-12 | 1.94 ms | 4.00 ms | 2.1x faster |
| single-groupby-5-8-1 | 1.17 ms | 2.56 ms | 2.2x faster |
QuestDB leads five of the six single-groupby queries, by up to 2.6x once a query spans multiple hosts. TimescaleDB edges single-groupby-5-1-1, the shortest of the six, by 1.1x.
Double-Groupby Queries
These queries aggregate across ALL 4,000 hosts, grouped by host and 1-hour intervals - a common analytical workload.
↓ Lower is better
Aggregates across ALL 4,000 hosts, grouped by host and 1-hour intervals · median of 3 runs, warm cache
QuestDB, double-groupby-all
TimescaleDB, double-groupby-all
| Query | QuestDB (median) | TimescaleDB (median) | QuestDB Advantage |
|---|---|---|---|
| double-groupby-1 | 32.20 ms | 2,211 ms* | 68.7x faster |
| double-groupby-5 | 41.20 ms | 2,962 ms* | 71.9x faster |
| double-groupby-all | 56.10 ms | 1,199 ms | 21.4x faster |
* These two are slower than double-groupby-all on the same run, which is counter-intuitive: aggregating one metric should not cost more than aggregating ten. We re-ran them on three separate instances and got 2,208.51, 2,212.48 and 2,210.94 ms for double-groupby-1, and 2,960.13, 2,960.51 and 2,966.66 ms for double-groupby-5. The behaviour is stable rather than a bad run, so we publish what we measured.
These scan every host for the whole window and aggregate by host and hour. QuestDB reads only the columns it needs and aggregates them across all cores; TimescaleDB works row by row through PostgreSQL's executor.
CPU-max-all Queries
These take the maximum of all ten CPU metrics across 1, 8 and 32 hosts. They are the queries where the gap widens fastest as more series come into scope.
↓ Lower is better
Maximum of all 10 CPU metrics, across 1, 8 and 32 hosts
QuestDB, cpu-max-all-32-24
TimescaleDB, cpu-max-all-32-24
| Query | QuestDB (median) | TimescaleDB (median) | QuestDB Advantage |
|---|---|---|---|
| cpu-max-all-1 | 1.48 ms | 2.58 ms | 1.7x faster |
| cpu-max-all-8 | 5.40 ms | 17.19 ms | 3.2x faster |
| cpu-max-all-32-24 | 5.37 ms | 218.50 ms | 40.7x faster |
TimescaleDB slows by 85x between one host and 32 while QuestDB slows by 3.6x, which is the clearest illustration on this page of what per-series overhead costs at query time.
Heavy Analytical Queries
These scan for hosts with CPU utilization above a threshold, either for one host or across all of them.
↓ Lower is better
Finding hosts with CPU utilization above threshold · median of 3 runs, warm cache
QuestDB, high-cpu-all
TimescaleDB, high-cpu-all
| Query | QuestDB (median) | TimescaleDB (median) | Best |
|---|---|---|---|
| high-cpu-1 | 3.31 ms | 2.99 ms | TimescaleDB 1.1x |
| high-cpu-all | 1,027.50 ms | 487.70 ms | TimescaleDB 2.1x |
TimescaleDB wins both. On the full scan it is more than twice as fast, and it has improved sharply here: the same query took 1,082 ms on 2.23.1. Worth noting that TimescaleDB is tuned to the hardware on this page while QuestDB runs defaults.
NB: QuestDB 10.0 was measured in the same run. Over QWP, its new binary protocol, it answers high-cpu-all in 672.60 ms. The tables on this page stay on 9.3.3, the version the whole suite was run against; full 10.0 results will come with our next benchmark suite rather than a TSBS re-run.
Lastpoint and Top-N Queries
↓ Lower is better
Latest reading per host, and top-N aggregation
QuestDB, lastpoint
TimescaleDB, lastpoint
TimescaleDB, groupby-orderby-limit
| Query | QuestDB (median) | TimescaleDB (median) | Best |
|---|---|---|---|
| lastpoint | 1.70 ms | 20.50 ms | 12.1x faster |
| groupby-orderby-limit | 16.76 ms | 11.09 ms | TimescaleDB 1.5x |
lastpoint retrieves the most recent reading for every host, one of the most
common time-series operations there is. QuestDB's LATEST ON
is built for exactly this pattern. groupby-orderby-limit tests top-N
aggregation, where TimescaleDB is ahead.
NB: QuestDB 10.0 was measured in the same run. Over QWP, its new binary protocol, it answers groupby-orderby-limit in 11.75 ms. The tables on this page stay on 9.3.3, the version the whole suite was run against; full 10.0 results will come with our next benchmark suite rather than a TSBS re-run.
Architecture overview
Why the numbers come out this way.
TimescaleDB overview
TimescaleDB is a PostgreSQL extension. A table becomes a hypertable, which PostgreSQL partitions into chunks by time interval and, optionally, by a space key, so each chunk is a smaller table covering one time range.
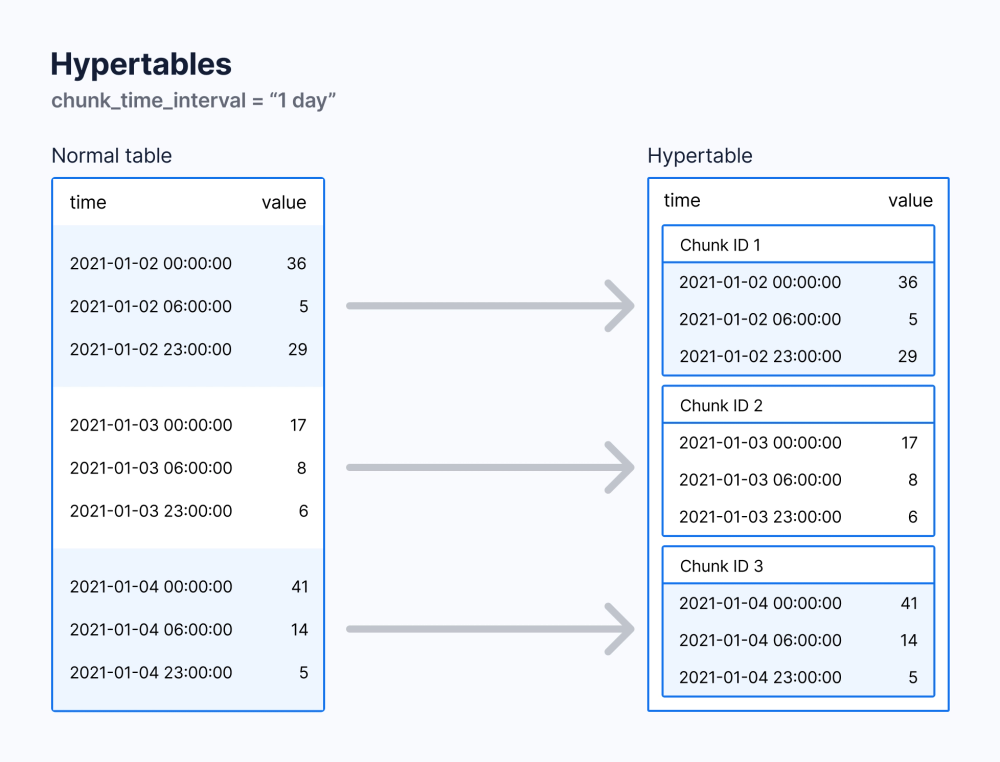
Storage is hybrid. Recent chunks stay in PostgreSQL's row format, so inserts go through the usual heap and B-tree path. Older chunks are converted to Hypercore, TimescaleDB's compressed columnar format, for analytical queries. Writes land in row format first and are converted later, where QuestDB writes columnar from the start.
Everything PostgreSQL offers is available: joins, secondary and partial indexes, extensions such as PostGIS. One constraint carries over: a unique index or primary key on a hypertable must include the time column, because PostgreSQL enforces uniqueness per chunk.
QuestDB architecture
QuestDB is an open-source time series database written in zero-GC Java, C++ and Rust. Data comes in over QWP or InfluxDB Line Protocol and queries are SQL. Storage has three tiers:
Tier 1 - Write-Ahead Log (WAL): Incoming writes land in a WAL for durability. The WAL buffers and sorts out-of-order data before committing to storage.
Tier 2 - Columnar partitions: Data is organized into time-partitioned columnar files. Each partition stores columns in separate files, so queries read only the columns they need and scan them in parallel with SIMD.
Tier 3 - Cold storage (Parquet): Older partitions can be converted to Parquet and moved to object storage (S3, Azure Blob, GCS). Queries span all tiers.
Tier One: Hot ingest (WAL), durable by default
Incoming data is appended to the write-ahead log (WAL) with ultra-low latency. Writes are made durable before any processing, preserving order and surviving failures without data loss. The WAL is asynchronously shipped to object storage, so new replicas can bootstrap quickly and read the same history.
Tier Two: Real-time SQL on live data
Data is time-ordered and de-duplicated into QuestDB's native, time-partitioned columnar format and becomes immediately queryable. Power real-time analysis with vectorized, multi-core execution, streaming materialized views, and time-series SQL (e.g., ASOF JOIN, SAMPLE BY). The query planner spans tiers seamlessly.
Tier Three: Cold storage, open and queryable
Older data is automatically tiered to object storage in Apache Parquet. Query it in-place through QuestDB or use any tool that reads Parquet. This delivers predictable costs, interoperability with AI/ML tooling, and zero lock-in.
Unlike TimescaleDB's hypertable architecture built on PostgreSQL's row-based storage, QuestDB stores all time series in a single columnar table structure. This means adding new series (high cardinality) doesn't create additional storage overhead, the same columnar files simply contain more rows. This architectural difference explains why QuestDB maintains consistent performance as cardinality scales.
QuestDB stores history as Parquet, returns query results as Arrow over QWP, and since 10.0 writes Parquet that the Iceberg ecosystem reads directly, so the data is never locked to QuestDB. Tiering cold partitions to object storage is a QuestDB Enterprise feature. TimescaleDB's data lives in PostgreSQL's storage format. Both speak the PostgreSQL wire protocol, so PostgreSQL tooling works with either.
Filters are compiled with a JIT compiler and run in parallel over time-partitioned storage. New columns are added on ingest, and schema changes do not block writes. Clients connect over QWP, InfluxDB Line Protocol, PGWire or REST, with client libraries in the main languages, and the SQL carries time-series extensions.
TimescaleDB limitations
Both have limitations. TimescaleDB first.
Temporal JOINs and missing time-based extensions
Timescale does not support joining tables based on the nearest timestamp, also known as ASOF JOIN. These joins are everywhere in financial markets.
Some common time-series operations are awkward too. Retrieving the latest reading per symbol or per sensor means a lateral join. Compare:
- QuestDB
- PostgreSQL and Timescale
- DuckDB
-- QuestDB provides ASOF JOIN. Since table definition includes-- the designated timestamp column, no time condition is neededSELECT t.*, n.*FROM trades ASOF JOIN news ON (symbol);
There is no SAMPLE BY equivalent for periodic intervals, though continuous aggregates cover the fixed-interval case by pre-aggregating into summary tables.
Schema change overhead
Schema changes go through PostgreSQL's ALTER TABLE, which on a large hypertable can mean long locks and rewrites, depending on the change.
Ingestion and cardinality
Insert speed depends on how many indexes, foreign keys and unique constraints the table carries, and Timescale's own tuning guide is largely about removing them. Ingestion also degrades as cardinality rises, because of the row-based write path and the indexing. The recommended mitigation, fewer indexes and constraints, runs counter to what PostgreSQL is usually chosen for.
PostgreSQL extension
Installing TimescaleDB requires PostgreSQL first, then the extension, then time-series-specific tuning. QuestDB is dependency-free and ready out of the box. Less of an issue on managed cloud platforms, but adds maintenance overhead when self-hosting.
QuestDB limitations
Now QuestDB.
Type of workload & use case
TimescaleDB, built on PostgreSQL's row-based architecture, supports OLTP operations (INSERT, UPSERT, UPDATE, DELETE, triggers). QuestDB is columnar and optimized for OLAP and time series workloads: high ingest throughput, fast queries, and time-based analytics common in financial services, IoT, and Ad-Tech.
QuestDB is not designed for OLTP and is less suited for log monitoring use cases.
Weaker PostgreSQL compatibility
QuestDB supports PGWire, enabling use with most PostgreSQL libraries. However, it only supports forward-only cursors, not scrollable cursors via DECLARE CURSOR and FETCH. Some drivers like psycopg2 rely on scrollable cursors and may not be fully compatible.
Ecosystem maturity
Timescale has the larger set of third-party integrations. QuestDB's ecosystem is growing but smaller.
 Postgres
 Grafana
 Kafka
Kafka Redpanda
 Python
 Pandas
 Superset
 Spark
Spark Polars
 Telegraf
 MindsDB
 Flink
FlinkIs QuestDB a TimescaleDB replacement?
Not if what you want is PostgreSQL. TimescaleDB adds time series to a database you already run and know how to operate. At moderate volumes that is a sensible choice, and in this benchmark, tuned to the hardware, it wins the two threshold scans and the top-N query.
QuestDB is the stronger choice where speed is mission critical and data cannot afford to be lost: market data and trades, telemetry from an energy plant, a rocket or a fleet of robots. Those are high-speed time series, and a row store built for transactions isn't the right shape for them. QuestDB's architecture is: columnar storage, ingestion in the millions of rows per second, the latest state in milliseconds, time-series joins, and one SQL engine from live data to years of history.
The benchmark shows the gap. On default settings QuestDB ingests six to eight times faster than a tuned TimescaleDB at every cardinality, and it is far ahead on everything that aggregates across hosts. TimescaleDB stays close on the narrowest single-host reads.
QuestDB speaks the PostgreSQL wire protocol, so the drivers and tools you use today connect to it; what you give up is the rest of PostgreSQL, which the page covers above. If you're building something new and the data will matter, starting on QuestDB saves a migration later.
To get started, try our live demo, download QuestDB, or explore QuestDB Enterprise for production deployments.
For a single-workload comparison showing how QuestDB's dedicated SQL operators affect performance vs. standard SQL rewrites on TimescaleDB, see How we made WINDOW JOIN parallel and vectorized. This is not a standardized benchmark like TSBS.
Appendix: what each TSBS query does
Query names encode their parameters: single-groupby-5-8-1 is five metrics, eight hosts, one hour.
| Query | What it measures |
|---|---|
| single-groupby-M-H-T | Maximum of M CPU metrics for H random hosts, in 5-minute buckets over T hours. 1-1-1 is one metric, one host, one hour; the -12 variants cover twelve hours |
| double-groupby-M | Average of M CPU metrics for every host, grouped by host and by hour, over 24 hours. all is all ten metrics |
| cpu-max-all-H | Maximum of all ten CPU metrics for H random hosts, per hour. -1 and -8 cover one hour; -32-24 covers 32 hosts over 24 hours |
| high-cpu-1 | Every reading where one metric is above a threshold, for one random host |
| high-cpu-all | The same threshold scan across every host, which is a full-table scan |
| lastpoint | The most recent reading for every host |
| groupby-orderby-limit | The last five per-minute aggregates before a random point in time, ordered by time, a top-N query |
Definitions follow the TSBS README. Every query is generated with seed 123 against the 4,000-host dataset, so each engine answers the same random hosts and time ranges.