Benchmark and comparison: QuestDB vs. InfluxDB v1/v2
Benchmarks and an overview of InfluxDB versus QuestDB to compare features, functionality, performance, and ease of use.



InfluxDB is one of the most widely used time-series databases. InfluxData released it in 2013 for metrics and monitoring, with Telegraf as the collector and a measurement-and-tag model that made dashboards over server and application metrics easy. v1 and v2 run on the TSM engine; InfluxDB 3 is a ground-up rewrite with a different storage and query engine and has its own comparison. QuestDB is the leading open-source time-series database for streaming ingestion and low-latency queries. It came out of trading floors and sits on the critical path in trading, defense, energy and robotics systems, where throughput is high and data cannot be lost.
The difference comes down to what happens if data is lost. InfluxDB is built for monitoring, where data gets downsampled over time and a few lost points don't matter. QuestDB is for the data that cannot be lost: the full-fidelity operational record, with the newest state available in milliseconds, years of history behind it, and one SQL engine across all of it.
Choose InfluxDB for infrastructure monitoring, Telegraf pipelines and dashboards over a known set of series. Choose QuestDB when the data is mission critical.
This article runs InfluxDB v1.12.4, InfluxDB v2.9.1 and QuestDB 9.3.3 through the same TSBS workload on the same machine, publishes every result, and shows where the architectural difference starts to matter.
Key results: QuestDB ingests 7 to 8.6 million rows per second at every cardinality we tested, while InfluxDB falls from 1.1 million to under 240K as hosts increase. InfluxDB v1 is faster on the narrowest single-host queries; QuestDB is faster on every query that aggregates across hosts, by a wide margin.
These benchmarks predate QWP, the binary protocol we shipped in QuestDB 10.0 in August 2026. Ingestion here runs over InfluxDB Line Protocol, a text format the server parses row by row. QWP sends binary columns instead, up to 3.6x faster over a network, and it streams reads back as Arrow. Read the QuestDB figures below as a floor.
Monitoring-first versus record-first
InfluxDB earned its position by making monitoring easy. The measurement-and-tag model, retention policies and the Telegraf ecosystem fit well when the series are known in advance, most questions stay close to one metric, and old data can be rolled up or expired.
QuestDB is for the other case: systems on the critical path, where every event matters, the number of entities keeps growing, and the same data is used for what is happening right now, for calculations across devices or symbols, and for years of history. Dimensions stay typed columns instead of becoming part of a series key, standard SQL joins and aggregates across them, and one engine covers all of it.
Introduction to InfluxDB and QuestDB
QuestDB is an open-source time-series database licensed under Apache License 2.0. Written in low-latency (Zero-GC) Java and C++, with Rust for the distributed layer of QuestDB Enterprise, it is designed for low-latency, high-throughput ingestion and fast analytical queries using standard SQL. QuestDB uses a columnar storage model where all time series live in a single table structure, avoiding per-series overhead.
InfluxDB is a time-series database developed by InfluxData. The open-source versions (v1 under MIT, v2 OSS under proprietary license) are written in Go. InfluxDB uses a measurement-based data model where each unique combination of tags creates a separate series with its own storage structure.
| Aspect | QuestDB | InfluxDB |
|---|---|---|
| License | Apache 2.0 | v1: MIT, v2 OSS: Proprietary |
| Implementation | Java, C++, Rust | Go |
| Query language | Standard SQL | InfluxQL, Flux |
| Data model | Relational (tables + rows) | Measurement-based (series) |
| Ingestion protocols | QWP (binary), ILP, PostgreSQL wire, HTTP | ILP, HTTP API |
| High cardinality | No performance impact | Performance degrades |
Performance benchmarks
We use the open-source, industry-standard Time Series Benchmark Suite (TSBS) for all benchmarks, which supports InfluxDB (v1 and v2) and QuestDB out of the box. TSBS was created by Timescale and has seen no real development upstream since 2023, so we maintain our own fork.
Hardware: AWS EC2 r8a.8xlarge (32 vCPU, 256 GB RAM, AMD EPYC), GP3 EBS storage (20,000 IOPS, 1 GB/s throughput)
Software: Ubuntu 22.04, InfluxDB v1.12.4, InfluxDB v2.9.1, QuestDB 9.3.3, all with default configurations.
Measured: InfluxDB v1.12.4 and v2.9.1, benchmarked August 2026. QuestDB 9.3.3, on the same r8a.8xlarge instance. New benchmarks on QuestDB 10.0 are coming.
Core allocation: the TSBS client and the database run on the same instance with no CPU pinning.
Query statistic: each figure is the median latency within a run, averaged over 3 runs, with a warm query cache.
Ingestion benchmark
We test a cpu-only scenario with two days of CPU data for various numbers of simulated hosts (1K, 4K, 100K, and 1M). This tests how each database handles increasing data volumes and cardinality.
We start at 1,000 hosts. Smaller datasets finish in under a second on the faster engines, where setup cost dominates and the result stops measuring throughput.
In time-series databases, high cardinality refers to having many unique values in indexed columns, for example millions of unique symbols, account IDs, or trading venues. More hosts in this benchmark means higher cardinality.
Example commands:
$ ./tsbs_generate_data --use-case="cpu-only" --seed=123 --scale=4000 \--timestamp-start="2016-01-01T00:00:00Z" \--timestamp-end="2016-01-03T00:00:00Z" \--log-interval="10s" --format="influx" > /tmp/influx_data$ ./tsbs_load_influx --db-name=benchmark --file=/tmp/influx_data \--urls=http://localhost:8086 --workers=32
The same data, seed and worker count against QuestDB:
$ ./tsbs_generate_data --use-case="cpu-only" --seed=123 --scale=4000 \--timestamp-start="2016-01-01T00:00:00Z" \--timestamp-end="2016-01-03T00:00:00Z" \--log-interval="10s" --format="questdb" > /tmp/questdb_data$ ./tsbs_load_questdb --file=/tmp/questdb_data --workers=32
The results for ingestion with 32 workers:
↑ Higher is better
QuestDB peak rows/sec, at 100K hosts
InfluxDB v1 peak rows/sec, at 1K hosts
InfluxDB v2 peak rows/sec, at 1K hosts
| Scale | InfluxDB v1.12.4 | InfluxDB v2.9.1 | QuestDB | QuestDB vs v1 | QuestDB vs v2 |
|---|---|---|---|---|---|
| 1,000 hosts | 1.14M rows/sec | 618K rows/sec | 7.77M rows/sec | 6.8x faster | 12.6x faster |
| 4,000 hosts | 856K rows/sec | 503K rows/sec | 7.96M rows/sec | 9.3x faster | 15.8x faster |
| 100,000 hosts | 541K rows/sec | 378K rows/sec | 8.59M rows/sec | 15.9x faster | 22.7x faster |
| 1,000,000 hosts | 237K rows/sec | 210K rows/sec | 7.14M rows/sec | 30.2x faster | 34.0x faster |
Key observations:
- QuestDB holds between 7.1M and 8.6M rows/sec from 1,000 hosts to 1M
- InfluxDB v1 falls from 1.1M to 237K rows/sec over the same range, and v2 from 618K to 210K
Why does cardinality affect InfluxDB?
The performance gap widens with scale because of how each database handles cardinality. InfluxDB creates a separate TSM (Time-Structured Merge) tree for each unique series. At 100,000 hosts with 10 metrics each, that's 1,000,000 separate storage structures to maintain, index, and compact, which explains the throughput degradation.
QuestDB stores all data in a single columnar table regardless of cardinality. Adding more hosts simply adds more rows to the same structure, and throughput stays between 7.14M and 8.59M rows/sec from 1,000 hosts to 1M while InfluxDB v1 falls by almost 5x over the same range.
Query performance
Queries next. The TSBS suite has six families:
- single-groupby: Aggregate CPU metrics for random hosts over specified time ranges
- double-groupby: Aggregate across ALL hosts, grouped by host and time intervals
- cpu-max-all: Maximum of all ten CPU metrics across 1, 8 or 32 hosts
- high-cpu-1 and high-cpu-all: Hosts with CPU utilization above a threshold, for one host and for the full table
- lastpoint: The most recent reading for every host
- groupby-orderby-limit: Top-N aggregation over a time range
All queries target two days of 4000 emulated host data.
To run the benchmark:
$ ./tsbs_generate_queries --use-case="devops" --seed=123 --scale=4000 \--timestamp-start="2016-01-01T00:00:00Z" \--timestamp-end="2016-01-03T00:00:00Z" \--queries=1000 --query-type="single-groupby-1-1-1" \--format="influx" > /tmp/influx_query$ ./tsbs_run_queries_influx --file=/tmp/influx_query \--db-name=benchmark --workers=1
And against QuestDB:
$ ./tsbs_generate_queries --use-case="devops" --seed=123 --scale=4000 \--timestamp-start="2016-01-01T00:00:00Z" \--timestamp-end="2016-01-03T00:00:00Z" \--queries=1000 --query-type="single-groupby-1-1-1" \--format="questdb" > /tmp/questdb_query$ ./tsbs_run_queries_questdb --file=/tmp/questdb_query --workers=1
Single-groupby queries
Query names encode metrics, hosts and hours: 5-8-1 is five metrics, eight hosts, one hour. Every query on this page is described in the appendix.
↓ Lower is better
Query format: metrics-hosts-hours · median of 3 runs, warm cache
QuestDB, single-groupby-5-1-12
InfluxDB v1, single-groupby-5-1-12
InfluxDB v2, single-groupby-5-1-12
| Query | InfluxDB v1.12.4 | InfluxDB v2.9.1 | QuestDB | Best |
|---|---|---|---|---|
| single-groupby-1-1-1 | 0.31 ms | 0.59 ms | 0.41 ms | InfluxDB v1 |
| single-groupby-1-1-12 | 2.00 ms | 3.03 ms | 1.43 ms | QuestDB |
| single-groupby-1-8-1 | 0.88 ms | 1.44 ms | 0.91 ms | InfluxDB v1 |
| single-groupby-5-1-1 | 0.93 ms | 1.48 ms | 0.60 ms | QuestDB |
| single-groupby-5-1-12 | 7.31 ms | 11.05 ms | 1.94 ms | QuestDB |
| single-groupby-5-8-1 | 2.81 ms | 3.73 ms | 1.17 ms | QuestDB |
Double-groupby queries
↓ Lower is better
Aggregates across ALL hosts, grouped by host and 1-hour intervals · median of 3 runs, warm cache
QuestDB, double-groupby-all
InfluxDB v1, double-groupby-all
InfluxDB v2, double-groupby-all
These queries aggregate across ALL hosts, grouped by host and 1-hour intervals.
| Query | InfluxDB v1.12.4 | InfluxDB v2.9.1 | QuestDB | QuestDB vs v1 | QuestDB vs v2 |
|---|---|---|---|---|---|
| double-groupby-1 | 985 ms | 1,037 ms | 32.20 ms | 30.6x faster | 32.2x faster |
| double-groupby-5 | 4,431 ms | 4,561 ms | 41.20 ms | 108x faster | 111x faster |
| double-groupby-all | 8,649 ms | 8,928 ms | 56.10 ms | 154x faster | 159x faster |
CPU-max-all and high-cpu queries
Filtered scans that take the maximum of all ten CPU metrics across 1, 8 and 32 hosts, plus the single-host variant of the high-cpu threshold scan.
↓ Lower is better
Filtered scans over 1, 8 and 32 hosts
QuestDB, cpu-max-all-32-24
InfluxDB v1, cpu-max-all-32-24
InfluxDB v2, cpu-max-all-32-24
| Query | InfluxDB v1.12.4 | InfluxDB v2.9.1 | QuestDB | Best |
|---|---|---|---|---|
| cpu-max-all-1 | 1.47 ms | 1.67 ms | 1.48 ms | level with v1 |
| cpu-max-all-8 | 2.17 ms | 2.67 ms | 5.40 ms | InfluxDB v1 2.5x |
| cpu-max-all-32-24 | 14.70 ms | 18.60 ms | 5.37 ms | QuestDB 2.7x / 3.5x |
| high-cpu-1 | 2.15 ms | 2.39 ms | 3.31 ms | InfluxDB v1 1.5x |
InfluxDB wins the narrow scans and QuestDB wins the wide ones. Reading a handful of series is cheap when each one is stored separately; the position reverses once a query has to touch 32 hosts at 24 hours.
Lastpoint and top-N queries
↓ Lower is better
Latest reading per host, and top-N aggregation
QuestDB, lastpoint
InfluxDB v1, lastpoint
InfluxDB v2, lastpoint
| Query | InfluxDB v1.12.4 | InfluxDB v2.9.1 | QuestDB | Best |
|---|---|---|---|---|
| lastpoint | 302.10 ms | 808.20 ms | 1.70 ms | QuestDB 178x / 475x |
| groupby-orderby-limit | 749.19 ms | 1,234.43 ms | 16.76 ms | QuestDB 45x / 74x |
lastpoint fetches the most recent reading for every host, which is one of the
most common time-series operations there is. QuestDB answers it in 1.7 ms with
LATEST ON; InfluxDB takes 302 ms on v1 and 808 ms
on v2, because it has to open every series to find the end of each one.
Heavy queries
high-cpu-all query latency · ↓ Lower is better
Full table scan finding hosts with CPU utilization above threshold · median of 3 runs, warm cache
QuestDB, high-cpu-all
InfluxDB v1, high-cpu-all
InfluxDB v2, high-cpu-all
Full table scan finding hosts with CPU utilization above threshold.
| Query | InfluxDB v1.12.4 | InfluxDB v2.9.1 | QuestDB | QuestDB vs v1 | QuestDB vs v2 |
|---|---|---|---|---|---|
| high-cpu-all | 15,430.5 ms | 16,050.2 ms* | 1,027.50 ms | 15.0x faster | 15.6x faster |
* At roughly 16 seconds per query, InfluxDB v2.9.1 ran 50 queries for this type where InfluxDB v1.12.4 and QuestDB each ran 1,000. The full count would not have finished, so the v2 figure here rests on fewer samples than the rest of the table.
NB: QuestDB 10.0 was measured in the same run. Over QWP, its new binary protocol, it answers high-cpu-all in 672.60 ms. The tables on this page stay on 9.3.3, the version the whole suite was run against; full 10.0 results will come with our next benchmark suite rather than a TSBS re-run.
Explaining query performance
QuestDB outperforms both InfluxDB versions on analytical queries. Every aggregation across hosts completes in under 60 ms on QuestDB and takes one to nine seconds on InfluxDB v1 and v2. InfluxDB v1 has the edge on four narrow queries, two short single-metric aggregations plus cpu-max-all-8 and high-cpu-1, by up to 2.5x. InfluxDB has addressed the heavy-aggregation gap in InfluxDB 3 Core, which is several times faster than v1 and v2 on double-groupby and the full-table scan, though slower on the narrow queries.
Double group by queries
Aggregate across both time and host.
These scan every host for the whole window and aggregate by host and hour. QuestDB reads only the columns it needs from the partition files and aggregates them across all cores with SIMD, so adding metrics adds little. InfluxDB has to open and merge one series per host per metric, so its cost grows with the number of metrics.
Single group by queries
Simple aggregation on metrics for specific hosts over time ranges.
Reading one field for one host over one hour is cheap when every field is its own series, which is why InfluxDB v1 edges the two shortest queries. As soon as a query touches more metrics, hosts or hours, QuestDB's columnar scan pulls ahead, and the margin grows with the amount of data touched.
Heavy analytical queries (high-cpu-all)
Full table scan finding hosts above CPU threshold.
A full-table scan with a filter on one metric. QuestDB evaluates the filter with a JIT-compiled predicate across all partitions in parallel; InfluxDB has to walk every series to apply it.
What are the data models used in InfluxDB and QuestDB?
The data model is where the performance difference starts. InfluxDB uses a measurement-based model optimized for tagged time series, while QuestDB uses a relational model that stores all data in tables.
InfluxDB: Measurement-based model
InfluxDB organizes data around measurements, tags, and fields:
measurementName,tagKey=tagValue fieldKey="fieldValue" 1465839830100399000--------------- --------------- --------------------- -------------------| | | |Measurement Tags Fields Timestamp
- Measurement: Similar to a table name, groups related data points
- Tags: Indexed key-value pairs (strings only) used for filtering and grouping
- Fields: Non-indexed values containing the actual metrics (floats, integers, strings, booleans)
- Timestamp: Nanosecond-precision time
A series in InfluxDB is defined as a unique combination of measurement + tagset. For example:
trades,symbol=AAPL,exchange=NYSE price=185.50,size=100 1705311000123456000trades,symbol=MSFT,exchange=NASDAQ price=390.25,size=250 1705311000123789000
These two lines create two separate series because their tagsets differ. Each unique series gets its own TSM storage structure. This is why high-cardinality workloads (many unique tag combinations) degrade InfluxDB performance: thousands of unique symbol values means thousands of separate series to maintain.
QuestDB: Relational model
QuestDB uses a standard relational model where data lives in tables with typed columns:
CREATE TABLE trades (timestamp TIMESTAMP,symbol SYMBOL, -- Dictionary string (similar to InfluxDB tags)exchange SYMBOL,side SYMBOL,price DOUBLE,size DOUBLE) TIMESTAMP(timestamp) PARTITION BY DAY;
Market data in QuestDB is simply rows in a table:
| timestamp | symbol | exchange | side | price | size |
|---|---|---|---|---|---|
| 2024-01-15T09:30:00.123456Z | AAPL | NYSE | buy | 185.50 | 100 |
| 2024-01-15T09:30:00.123789Z | MSFT | NASDAQ | sell | 390.25 | 250 |
Adding new symbols or exchanges doesn't create new storage structures, it just adds more rows. This is why QuestDB handles high cardinality without performance degradation.
Data type support:
| Category | QuestDB Types |
|---|---|
| Integer | BYTE, SHORT, INT, LONG, LONG128, LONG256 |
| Floating point | FLOAT, DOUBLE, DECIMAL |
| String | STRING, VARCHAR, CHAR, SYMBOL (indexed) |
| Temporal | TIMESTAMP (nanosecond precision), DATE, INTERVAL |
| Geospatial | GEOHASH |
| Collections | ARRAY |
| Other | BOOLEAN, UUID, IPv4, BINARY |
QuestDB supports InfluxDB line protocol for compatibility, automatically mapping tags to SYMBOL columns and fields to appropriate types, so Telegraf and existing collectors keep working. Since QuestDB 10.0 the primary path is QWP, a binary wire protocol that carries typed columns rather than text lines, including arrays, handles queries as well as writes, and streams results back as Apache Arrow. The PostgreSQL wire protocol and REST API remain available.
Key model differences
| Aspect | QuestDB | InfluxDB |
|---|---|---|
| Data organization | Tables + rows | Measurements + series |
| Tag handling | SYMBOL columns (indexed strings) | Creates separate series per tagset |
| High cardinality | No impact (just more rows) | Performance degrades (more series = overhead) |
| Query language | Standard SQL | InfluxQL / Flux |
| JOINs | Full SQL JOIN support | Not supported |
| Schema | Schema-on-write or predefined | Schema-on-write |
Comparing database storage models
InfluxDB: TSM Trees
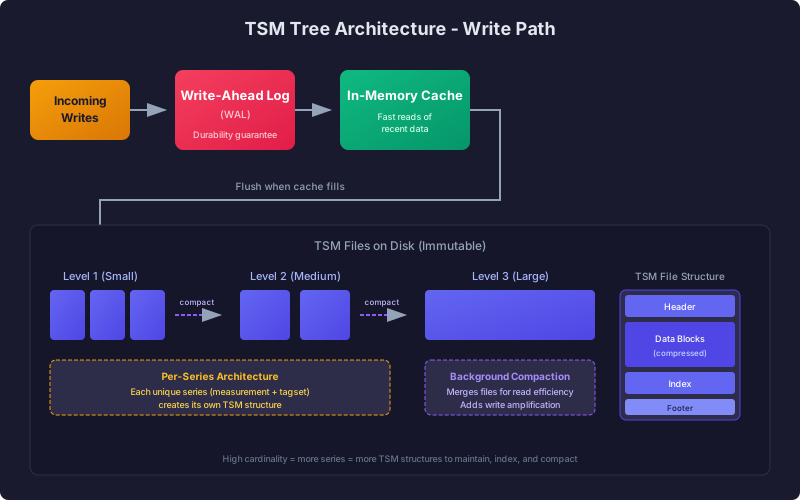
For storage, InfluxDB uses Time-Structured Merge (TSM) Trees, an LSM-tree variant optimized for time-series data. Writes first go to a write-ahead log (WAL) for durability, then into an in-memory cache that serves fast reads of recent data. When the cache fills, data is flushed to immutable TSM files on disk. Background compaction continuously merges smaller TSM files into larger ones to improve read efficiency, though this adds write amplification overhead.
Each unique series (measurement + tagset combination) creates its own TSM structure. This per-series architecture explains why high-cardinality workloads degrade InfluxDB's performance: more unique series means more TSM structures to maintain, index, and compact.
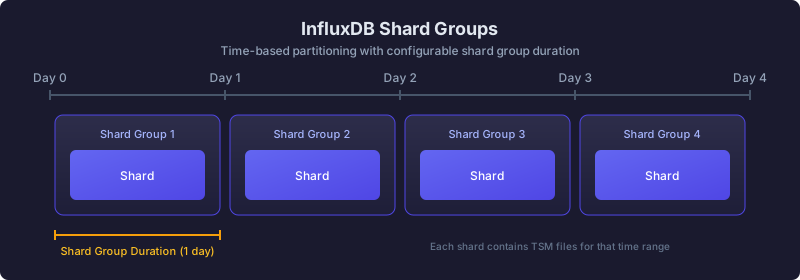
InfluxDB partitions by time with shard groups. The shard group duration sets how much time each shard covers, and retention policies drop shards older than a given age:
QuestDB: Three-tier columnar storage
QuestDB implements a three-tier storage architecture optimized for both high-throughput ingestion and fast analytical queries:
Tier 1 - Write-Ahead Log (WAL): Incoming writes first land in a write-ahead log, providing durability guarantees. The WAL handles out-of-order data by buffering and sorting before committing to the main storage layer.
Tier 2 - Columnar partitions: Data is organized into time-partitioned columnar files optimized for query performance. Each partition is a directory containing separate files per column, so queries read only the columns they need. This columnar layout combined with time partitioning enables parallel scans with SIMD instructions across multiple CPU cores.
Tier 3 - Cold storage (Parquet): Older partitions can be converted to Parquet format and moved to object storage (S3, Azure Blob, GCS) or local cold storage. Recent data stays on fast local storage, history gets cheaper, and queries span all tiers.
Tier One: Hot ingest (WAL), durable by default
Incoming data is appended to the write-ahead log (WAL) with ultra-low latency. Writes are made durable before any processing, preserving order and surviving failures without data loss. The WAL is asynchronously shipped to object storage, so new replicas can bootstrap quickly and read the same history.
Tier Two: Real-time SQL on live data
Data is time-ordered and de-duplicated into QuestDB's native, time-partitioned columnar format and becomes immediately queryable. Power real-time analysis with vectorized, multi-core execution, streaming materialized views, and time-series SQL (e.g., ASOF JOIN, SAMPLE BY). The query planner spans tiers seamlessly.
Tier Three: Cold storage, open and queryable
Older data is automatically tiered to object storage in Apache Parquet. Query it in-place through QuestDB or use any tool that reads Parquet. This delivers predictable costs, interoperability with AI/ML tooling, and zero lock-in.
Unlike InfluxDB's per-series TSM architecture, QuestDB stores all time series in a single table structure. This means adding new series (high cardinality) doesn't create additional storage overhead, the same columnar files simply contain more rows. This architectural difference explains why QuestDB maintains consistent performance as cardinality scales.
Query languages: SQL vs Flux
InfluxDB has gone through three query languages: InfluxQL, then Flux, and now SQL again in InfluxDB 3. QuestDB has used SQL from the start. Most engineers already know it, it works with BI tools, notebooks, ORMs and drivers without adapters, and what you learn on QuestDB carries over to PostgreSQL and the warehouses.
Flux vs SQL comparison
Flux uses a functional pipeline syntax that requires learning new concepts:
from(bucket: "metrics")|> range(start: -1h)|> filter(fn: (r) => r._measurement == "cpu" and r.host == "server1")|> aggregateWindow(every: 1m, fn: mean)
The equivalent in QuestDB SQL:
SELECT timestamp, avg(usage)FROM cpuWHERE host = 'server1' AND timestamp > dateadd('h', -1, now())SAMPLE BY 1m;
QuestDB's time-series SQL extensions
QuestDB extends standard SQL with purpose-built functions for time-series analysis:
| Extension | Purpose | Example |
|---|---|---|
SAMPLE BY | Time-based aggregation | SELECT avg(price) FROM trades SAMPLE BY 1h |
LATEST ON | Last value per group | SELECT * FROM trades LATEST ON timestamp PARTITION BY symbol |
ASOF JOIN | Time-aligned joins | Join trades with quotes at exact timestamps |
WHERE IN (ts, ts) | Time range filtering | Optimized partition pruning |
Ecosystem and integrations
Both integrate widely, with different strengths:
| Integration | QuestDB | InfluxDB |
|---|---|---|
| Grafana | Native data source | Native data source |
| Telegraf | Via ILP | Native |
| PostgreSQL tools | Full compatibility (psql, any PG driver) | Not supported |
| Client libraries | Python, Java, Go, Node.js, Rust, C/C++, .NET | Python, Java, Go, Node.js, and more |
| Kafka | Official Kafka connector | Native Kafka consumer |
| Pandas/Polars | Native integration | Via client library |
QuestDB's advantage: PostgreSQL wire protocol compatibility means PostgreSQL client libraries work with QuestDB, including psql, SQLAlchemy, and any PostgreSQL driver.
InfluxDB's advantage: As the older and more widely deployed database, InfluxDB has broader native integrations with monitoring tools and a larger collection of community Telegraf plugins.
Is QuestDB an InfluxDB replacement?
Not for every monitoring deployment. InfluxDB v1 and v2 remain a practical choice for established Telegraf pipelines, infrastructure and device metrics, dashboards, and narrow reads over a known set of series, and v1 wins several of the narrowest queries in this benchmark.
QuestDB is the stronger choice once the data is mission critical. Take energy plant monitoring, market data and trades, or telemetry from a rocket: a single lost record has consequences, the latest state has to be available immediately, and HA, backups, standard SQL and years of queryable history are requirements. That is what QuestDB is built for.
The benchmark shows the transition. QuestDB holds between 7.1 and 8.6 million rows per second from 1,000 to a million hosts, while InfluxDB v1 falls from 1.14 million to 237,000 and v2 from 618,000 to 210,000. InfluxDB v1 stays competitive on the narrowest reads; QuestDB is faster on everything that aggregates across hosts, and on the latest-point query by a wide margin.
Migration doesn't need a big-bang rewrite. QuestDB accepts InfluxDB Line Protocol, so Telegraf and existing collectors keep writing while you dual-write, settle the relational schema and move InfluxQL or Flux queries to SQL one workload at a time.
If you're building something new and the data will matter, starting on QuestDB saves a migration later.
Ready to try QuestDB? Get started with the quickstart guide or join our Slack community to ask questions.
Appendix: what each TSBS query does
Query names encode their parameters: single-groupby-5-8-1 is five metrics, eight hosts, one hour.
| Query | What it measures |
|---|---|
| single-groupby-M-H-T | Maximum of M CPU metrics for H random hosts, in 5-minute buckets over T hours. 1-1-1 is one metric, one host, one hour; the -12 variants cover twelve hours |
| double-groupby-M | Average of M CPU metrics for every host, grouped by host and by hour, over 24 hours. all is all ten metrics |
| cpu-max-all-H | Maximum of all ten CPU metrics for H random hosts, per hour. -1 and -8 cover one hour; -32-24 covers 32 hosts over 24 hours |
| high-cpu-1 | Every reading where one metric is above a threshold, for one random host |
| high-cpu-all | The same threshold scan across every host, which is a full-table scan |
| lastpoint | The most recent reading for every host |
| groupby-orderby-limit | The last five per-minute aggregates before a random point in time, ordered by time, a top-N query |
Definitions follow the TSBS README. Every query is generated with seed 123 against the 4,000-host dataset, so each engine answers the same random hosts and time ranges.