Measuring port congestion from free AIS data with NATS and QuestDB
How Port Context Engine turns the free public AIS feed into live port congestion data with five Go services, NATS JetStream and a single QuestDB container capped at 2 CPUs and 1 GB.


We'd like to thank Urtzi Alfaro, founder of Port Context Engine, for this blog post.
If you also want to contribute a community post, please reach out via the QuestDB Community Forum or the QuestDB Slack Channel.
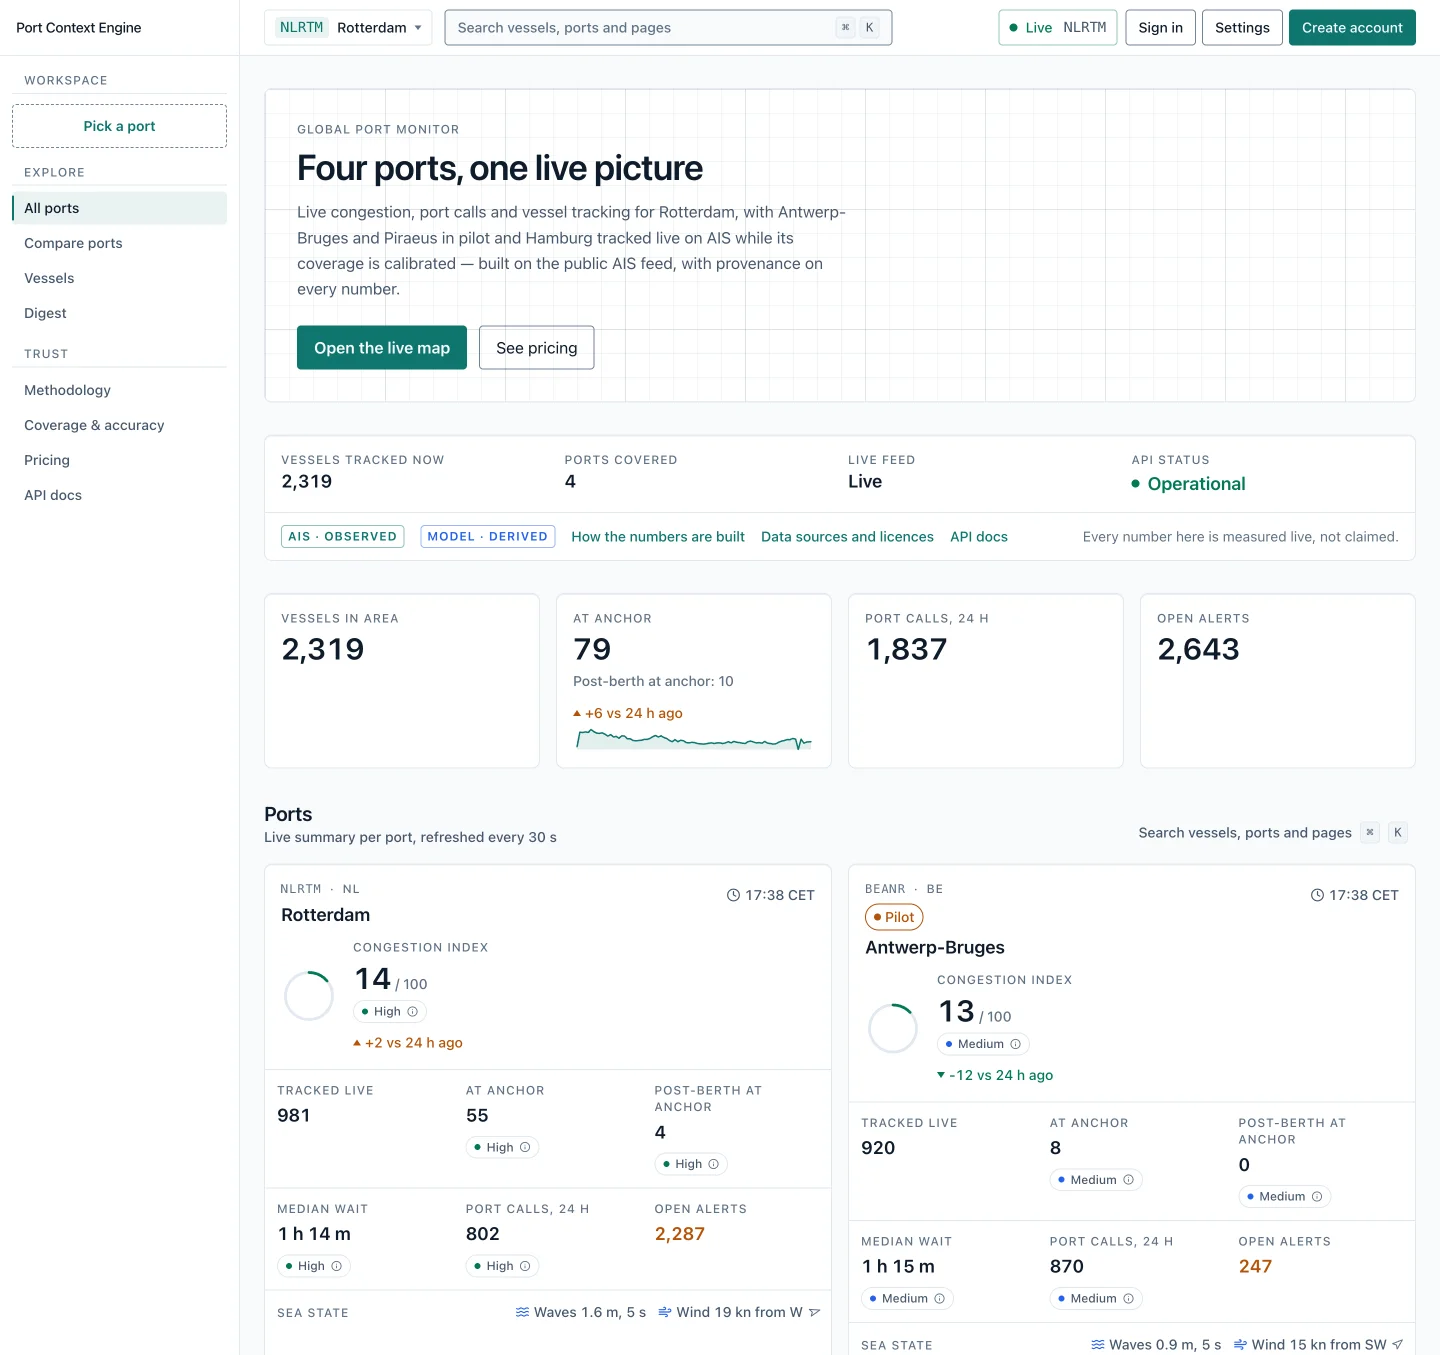
Port Context Engine shows how congested a port is right now: which ships are waiting at anchor, how long they wait, when they reach a berth, and how that compares with the last 90 days. It's built entirely on the public AIS feed, the radio signal every large ship broadcasts with its position, speed and identity.
It's built for chartering desks, port agents, terminal teams, forwarders, traders and maritime researchers: people whose costs move when ships queue. The product has been live since 2026-10-15 and is free to use, with Pro and API tiers in early access.
It covers four ports, each at a stage it has earned: Rotterdam live, Antwerp-Bruges and Piraeus in pilot, Hamburg calibrating. Every question it answers has a timestamp in it, which is why the storage layer is QuestDB.
Port Context Engine by the numbers
| Metric | Value |
|---|---|
| Ports covered | 4 |
| AIS messages, all 4 ports | About 860 a minute |
| Vessels seen in Rotterdam | 1,140 in 10 minutes |
| QuestDB tables | 8, all WAL |
| Raw positions kept hot | 7 days, then Parquet |
| 1-minute downsample kept | 90 days (TTL) |
| QuestDB container | 2 CPUs / 1 GB cap, ~465 MB idle |
| Public API, free | 500 calls/day, 1,000 with a free key |
| Team | 1 founder, AI agents write the code |
The message and vessel counts come from a 10-minute sample on 2026-10-20.
Ten minutes of AIS data chose the ports
In August the product covered Singapore, Rotterdam and Los Angeles, and by October the registry had grown to nine ports. Singapore kept under-counting, and I'd been chasing that as a bug. On 2026-10-20 I subscribed one free AISStream connection to 36 candidate ports at once for ten minutes and counted what came back:
| Port | Vessels | Msgs/min | Outcome |
|---|---|---|---|
| Rotterdam | 1,140 | 302 | Kept, flagship |
| Antwerp-Bruges | 1,058 | 277 | Kept |
| Hamburg | 517 | 166 | Kept |
| Piraeus | 486 | 112 | Kept |
| Los Angeles / Long Beach | 215 | 50 | Removed |
| Barcelona | 163 | n/a | Removed |
| Valencia | 158 | n/a | Removed |
| Singapore | 54 | 9 | Removed |
| Algeciras | 5 | 1.4 | Removed |
| China, Korea, India, Panama, Suez | 0 | 0 | Never added |
Free terrestrial AIS is strong in North-West Europe and the Eastern Mediterranean and thin elsewhere. The Singapore gap was coverage, not code, so five ports left the product. Removing their history from QuestDB turned into one of the lessons further down.
Architecture: five Go services, NATS JetStream and one time-series store
AIS positions arrive over an AISStream.io WebSocket. A Go collector validates each message and does two things with it: it publishes it as protobuf to NATS JetStream, and it writes the raw row straight to QuestDB over ILP. Downstream services consume JetStream, derive higher-level facts, and write those back to QuestDB over ILP too.
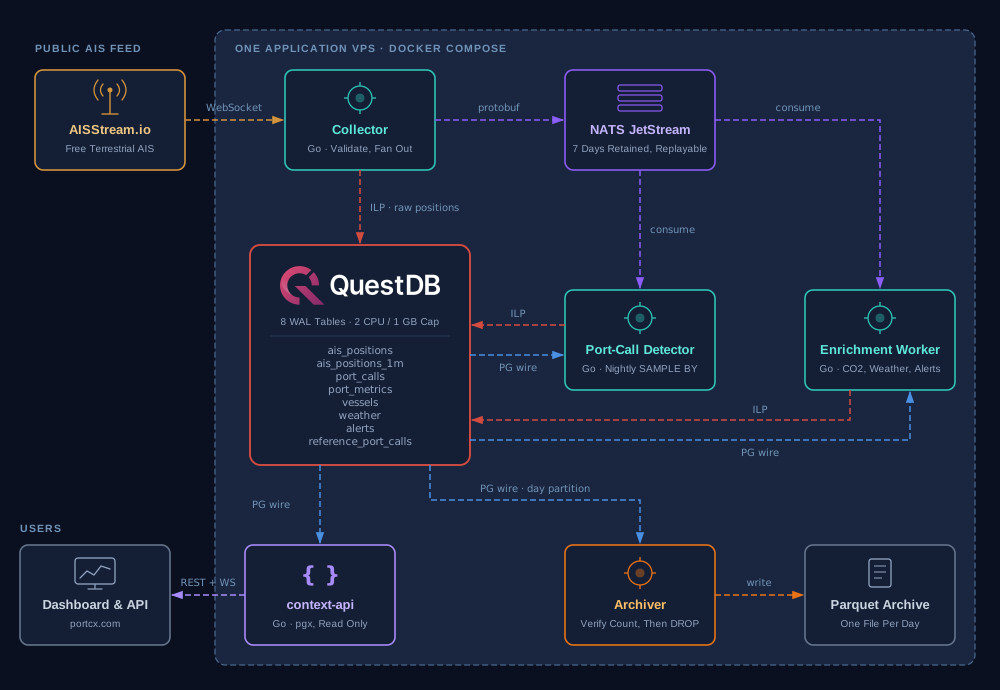
Reads all go through QuestDB's PostgreSQL wire protocol with the standard Go driver, jackc/pgx. The REST + WebSocket API and the nightly jobs never touch ILP, and the ingest services never serve queries. That split keeps both paths simple:
- collector writes
ais_positionsandvesselsover ILP and reads nothing. - port-call detector writes
port_callsandport_metrics, readsport_calls,port_metricsandvessels, and runs the nightly downsample. - enrichment worker writes
port_calls(the CO2 backfill),weather,alertsandreference_port_calls, and readsport_calls,vesselsandalerts. - context-api writes nothing and serves every public endpoint over PG wire.
- archiver writes nothing to QuestDB. It exports partitions to Parquet over PG wire and checks the row counts.
QuestDB runs as a single container, questdb/questdb:8.2.3 pinned by digest,
with the same image in Docker Compose for production and a Kubernetes manifest
for the dev cluster.
Why QuestDB fits a port congestion workload
This is not a throughput story; about 860 messages a minute is a light load. The fit is about the shape of the questions. Port calls, anchorage queues, vessel history and ETAs are all "what was true at time T" questions, and QuestDB answers each of them in one statement:
| Question | QuestDB feature |
|---|---|
| A ship's current name, type and draught | LATEST ON |
| The ETA a ship reported when it arrived | ASOF JOIN |
| Fold raw positions into 1-minute rows | SAMPLE BY |
| Rewrite a port-call phase when it closes | DEDUP UPSERT KEYS |
| Expire 1-minute data and vessel history | TTL |
| Retire a day of raw data once archived | DROP PARTITION |
The practical result for a one-person project: the Go services stay small, with no window-function gymnastics and no cleanup jobs beyond the archiver. Ingest speaks ILP and reads speak plain PostgreSQL wire, so the API uses the standard pgx driver.
Schema: eight tables, each with a designated timestamp
Every table is a WAL table with a designated timestamp and time partitioning. The retention policy, the deduplication rule and the read pattern are all declared in the DDL rather than in application code:
| Table | Partition | Retention | Dedup keys |
|---|---|---|---|
ais_positions | DAY | Archive, then drop | None |
ais_positions_1m | DAY | TTL 90 days | time, mmsi |
port_calls | MONTH | Kept | arrival_time, id |
port_metrics | MONTH | Kept | None |
vessels | MONTH | TTL 12 months | last_updated, mmsi |
weather | DAY | Kept | None |
alerts | MONTH | Kept | None |
reference_port_calls | MONTH | Kept | time, port_loccode, source |
Three design choices are worth calling out.
Port calls are upserted, not appended. Each row in port_calls is one
phase of a visit: a spell at anchor or a spell at berth. A phase is written when
it opens, rewritten when it closes, and rewritten again when the CO2 estimate is
backfilled. DEDUP UPSERT KEYS(arrival_time, id) makes each rewrite replace the
row in place. QuestDB requires the designated timestamp in every dedup key, so
the id is derived from the phase's arrival time (in seconds) and the vessel's
MMSI, which makes (arrival_time, id) unique per vessel and phase.
Vessels are history, not a lookup table. Static AIS data (name, type,
draught, destination, ETA) changes over time, so vessels is append-only.
Readers take the current record with LATEST ON, and historical questions use
ASOF JOIN (both shown below).
Low-cardinality strings are SYMBOLs. Port codes (UN/LOCODE), anchorage and
fence names, call types, alert types and severities are all SYMBOL. Raw
positions also declare a GEOHASH(6c)
column (cells of roughly 1.2 × 0.6 km), which isn't populated yet; no query
depends on it.
Ingest: ILP from Go, with a small wrapper
All writes use the official
Go client,
github.com/questdb/go-questdb-client/v3, over ILP/TCP. TCP was an early
choice. ILP over HTTP, which QuestDB recommends and which retries on its own,
would have made the redial wrapper below unnecessary, and moving to it is on
the list.
ILP over HTTP retries failed requests, but from QuestDB 10.0 onwards QWP goes further. The Go client's QWP sender reconnects on its own and buffers rows locally while the server is unreachable, then replays them once it's back. The redial logic in the wrapper below wouldn't be needed.
Each service owns one connection, wrapped in a small package
(internal/questdbilp) with one typed Append* method per table
(AppendPosition, AppendPortCall, AppendVessel, and so on). Table and
column names live as Go constants in that package, and the SQL DDL mirrors
them. A golden test pins the exact ILP bytes the client puts on the wire, so a
client upgrade that changes the encoding fails loudly.
The collector buffers positions in a ring of 8,192 rows and flushes to QuestDB every second. If the ring fills between flushes, the oldest rows are overwritten and counted in a metric, so the WebSocket reader never blocks.
A separate safeguard covers NATS. If JetStream signals backpressure, the
collector pauses its raw QuestDB writes. When the pressure clears, it replays
the paused window from JetStream, which keeps seven days of AIS messages, back
into QuestDB. ILP token auth and TLS are configuration switches
(QUESTDB_ILP_TOKEN_ID, QUESTDB_ILP_TOKEN, QUESTDB_ILP_TLS).
The wrapper adds two behaviours on top of the client:
- A bad row never poisons a batch. Row-level errors are latched, the
offending row is discarded, and the first error is reported on the next
Flush. Writing continues. - The writer redials after QuestDB restarts. The pinned client's TCP sender doesn't reconnect on its own: after a QuestDB restart (a deploy, a crash, a restore drill) every later write would fail on a dead socket while the service looked healthy. On a transport error the wrapper redials immediately, and if QuestDB is still down it retries at the start of every later flush. Rows buffered during the outage are counted as flush errors and dropped, and ingestion resumes on its own.
Flush counts, error counts and the time of the last successful flush are
exported as Prometheus metrics, so ingest lag is simply
time() - pce_ilp_last_flush_timestamp_seconds.
Queries: LATEST ON, ASOF JOIN and SAMPLE BY doing the real work
The queries below are taken from the codebase. The Go code builds them from
the column constants; here they're shown with the names written out and
COALESCE wrappers removed.
LATEST ON: the current state of a vessel
The vessel page needs the current static record and the last known position.
Both are LATEST ON queries. mmsi is a LONG, not a SYMBOL, so QuestDB
can't stop early and scans the whole time range in scope. That's why the
position query is bounded to the 7-day hot store:
SELECT imo, name, callsign, flag, ship_type, gross_tonnage, dwt,last_updated, destination, eta, draught_mFROM vesselsWHERE mmsi = $1LATEST ON last_updated PARTITION BY mmsi;
SELECT time, latitude, longitude, sog, cog, heading, nav_statusFROM ais_positionsWHERE mmsi = $1 AND time > dateadd('d', -7, now())LATEST ON time PARTITION BY mmsi;
Clause order matters here. With WHERE first, QuestDB filters and then picks
the latest row per vessel. Vessel search does the opposite: it wraps the
latest-row selection in a subquery
(FROM (vessels LATEST ON last_updated PARTITION BY mmsi)) and filters on the
name afterwards, so it matches current names only, never a ship's old ones. A
variant adds last_updated <= $2 to read the draught as it was before a given
arrival. LATEST ON appears in a dozen queries across the services.
ASOF JOIN: what the ship said when it arrived
A preview feature compares each ship's stated ETA with its actual arrival. The
right ETA is the one in force at the moment of arrival, not today's. With an
append-only vessels table, that's one ASOF JOIN:
SELECT pc.arrival_time, v.eta, v.ship_typeFROM port_calls pcASOF JOIN vessels v ON (mmsi)WHERE pc.port_loccode = $1AND pc.call_type = $2AND pc.departure_time IS NOT NULLAND pc.arrival_time >= $3;
$2 selects the anchorage phase: ships reach a berth only via the anchorage,
so the anchorage arrival is the actual arrival at the port. ASOF JOIN matches
each port-call row with the latest vessels row whose timestamp is at or
before its arrival time. The API then computes the median and P80 of
eta - arrival per vessel bucket (passenger, cargo, tanker, other) over 90
days. In plain PostgreSQL this would be a lateral subquery or a window function
over the whole history.
SAMPLE BY: the nightly 1-minute downsample
Raw positions are far denser than the 90-day views need. Once a day the detector folds yesterday into one row per vessel per minute:
INSERT INTO ais_positions_1mSELECT time, mmsi,first(latitude) latitude, first(longitude) longitude,avg(sog) sog, first(cog) cog, first(ship_type) ship_typeFROM ais_positionsWHERE time >= $1 AND time < $2SAMPLE BY 1m ALIGN TO CALENDAR;
Because ais_positions_1m has DEDUP UPSERT KEYS(time, mmsi), re-running the
job for the same day is idempotent: no cleanup, no "already ran" bookkeeping.
Data lifecycle: hot for 7 days, then Parquet, verified before drop
Raw positions stay in QuestDB for seven days. A nightly Go archiver then moves the oldest day out:
- Stream the 7-day-old day partition of
ais_positionsover PG wire into a temporary Parquet file (written with parquet-go), then rename it into place. - Count the rows in the Parquet file and compare with
SELECT count() FROM ais_positions WHERE time >= $1 AND time < $2. - Only if the counts match, run
ALTER TABLE ais_positions DROP PARTITION LIST '<day>'.
A day whose count is zero has nothing to export, but the archiver no longer
takes the count's word for it. Before dropping, it asks QuestDB directly how
many rows the partition holds, with
table_partitions():
SELECT numRowsFROM table_partitions('ais_positions')WHERE name = $1;
That check doesn't share the count query's time predicate. The partition is dropped only if it's absent or really empty. If the counts differ, or the two checks disagree, the partition stays, the Parquet file is kept for inspection, an error is logged and a metric is incremented. If the archiver misses a night, the partition simply stays, and an alert fires once raw data is eight days old. The downsample job deliberately never drops raw data, so the only route out is through the archiver.
DAY partitioning is what makes this cheap: a whole day's files go at once, with
no row-by-row DELETE. Two other tables use QuestDB's TTL instead (90 days for
the 1-minute downsample, 12 months for vessel history), so their retention
needs no job at all. Port calls, metrics, weather and alerts are kept.
Lessons learned running QuestDB 8.2.3
None of these were blockers, but each cost time. All were hit on
questdb/questdb:8.2.3 with the Go client v3.
QuestDB has moved on a long way since 8.2.3: the current release is QuestDB 10.1, and some of the behaviour below may differ on newer versions.
A wrong count looked like an empty day. The archiver's day-count first
filtered with an interval literal that, as I wrote it, matched nothing on
8.2.3. The archiver treated a count of 0 as "empty day, drop it", so in a local
rehearsal of the production setup the nightly job dropped every raw partition
without archiving it. I switched to a half-open range with bound parameters,
time >= $1 AND time < $2, and later added the second, independent guard
described above: a zero count is now checked against table_partitions()
before any drop. The bigger lesson is mine, not QuestDB's: test the query that
guards a destructive step against real data, not just its happy path, and never
let a single query be the only thing standing between a bug and a DROP.
Removing five ports meant deleting their rows, and QuestDB has no row-level
DELETE. A purge script reads each table's live DDL with
SHOW CREATE TABLE, so partitioning, WAL, TTL and dedup keys survive. It builds
a copy holding only the kept ports' rows and swaps it in with RENAME TABLE.
It's a dry run by default, and it takes backups first.
The ILP TCP sender doesn't reconnect after a server restart, so a service kept running while ingesting nothing. The fix is the redial wrapper described above. On QuestDB 10.0 or later, QWP removes the need for it.
ILP sends every integer as 64-bit and every float as a double. QuestDB can
cast them into narrower columns, but it rejects the whole line if a value would
lose data. I declared those columns as LONG and DOUBLE instead of
SHORT/INT/FLOAT, so no line is ever rejected on a narrowing cast. It
costs a little storage.
There's no hook to run init SQL on first boot. A one-shot migrate step
applies the DDL one statement at a time over the REST /exec endpoint.
A dedup key must include the designated timestamp. Port-call ids are
derived from arrival time plus MMSI, so (arrival_time, id) is the natural
key.
With http.user set, the health endpoint on :9003 also required basic
auth. The container healthcheck authenticates from its own environment.
Newer QuestDB versions control this with
http.health.check.authentication.required.
Final thoughts: economy over raw speed
What QuestDB buys this project is not raw speed but economy. The whole platform (five Go services, NATS, QuestDB and the dashboard) runs on one application VPS, with monitoring, CI and backups on a small ops hub shared with my other products. QuestDB itself is capped at 2 CPUs and 1 GB. That keeps the live product free while paid tiers are validated, and it means adding a port is mostly a registry entry and a cited anchorage polygon, not a new database.
For the people using it, the value is a congestion picture with provenance: every anchorage fence comes from a cited official source (Rijkswaterstaat for the Scheldt, the Greek Government Gazette for Piraeus), and a port's stage is shown honestly rather than implied.
What's next: validation scores for the pilot ports (Antwerp-Bruges, Piraeus)
against external port-call references, populating the GEOHASH column
(QuestDB casts an ILP string into it, so it's a few lines in the writer), and
moving ingest to ILP over HTTP.
Port Context Engine is live at portcx.com.
If you want to try AIS data in QuestDB yourself, our earlier post on tracking sea-faring ships with AIS data and Grafana is a good starting point.