Live dashboards
A notebook becomes a dashboard with three ingredients: the grid layout to arrange cells, auto-refresh to keep charts live, and variables to parameterize the whole board. Everything runs inside the console, no external dashboard tool required; for dashboards outside it, see the Grafana integration.
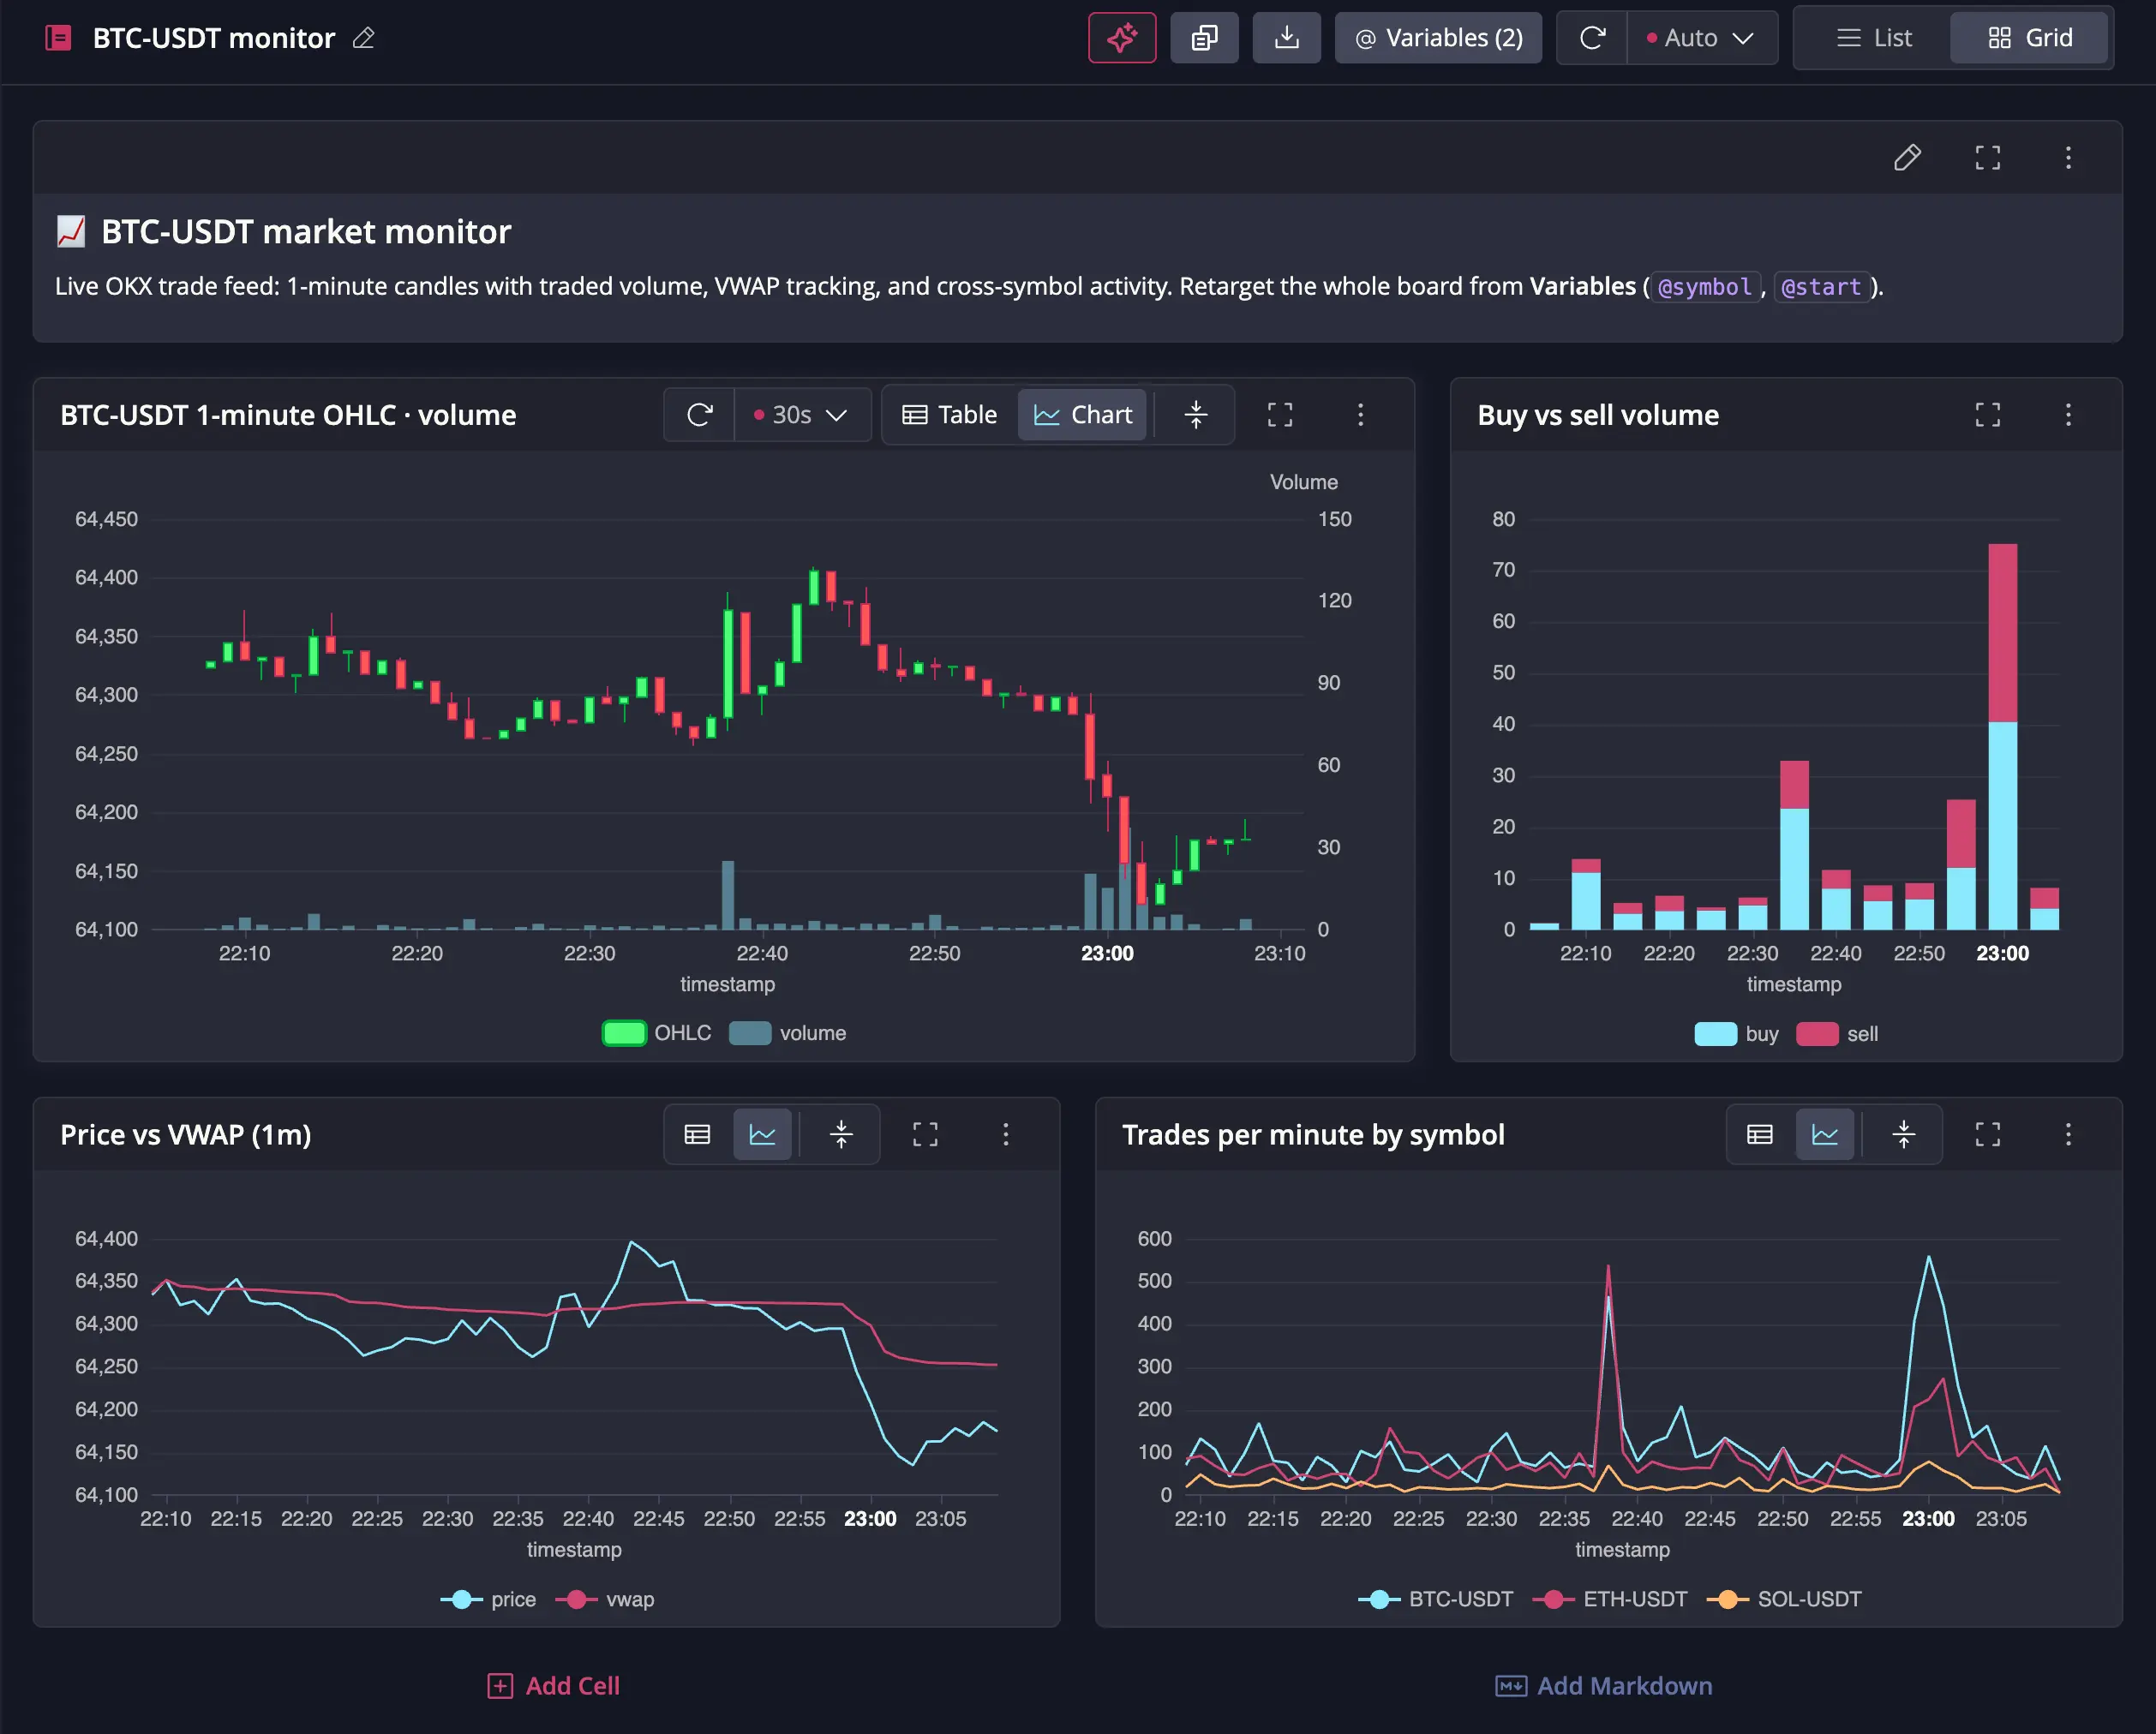
Grid layout
The List | Grid toggle on the toolbar switches the notebook's layout. The grid snaps cells to fixed columns. Drag a cell by its header to move it, and resize it from its edges and corners. Cells pack upward to fill gaps, and new cells land full-width at the bottom.
Two shortcuts: double-click a cell's header to expand it to the full width, and double-click a side resize handle to expand the cell toward that side.
For a clean dashboard, hide the SQL editors with Split/maximize view and use markdown cells for titles.
Auto-refresh
Chart cells refresh themselves on a schedule. The schedule has a notebook-wide default, and any cell can override it.
The notebook default
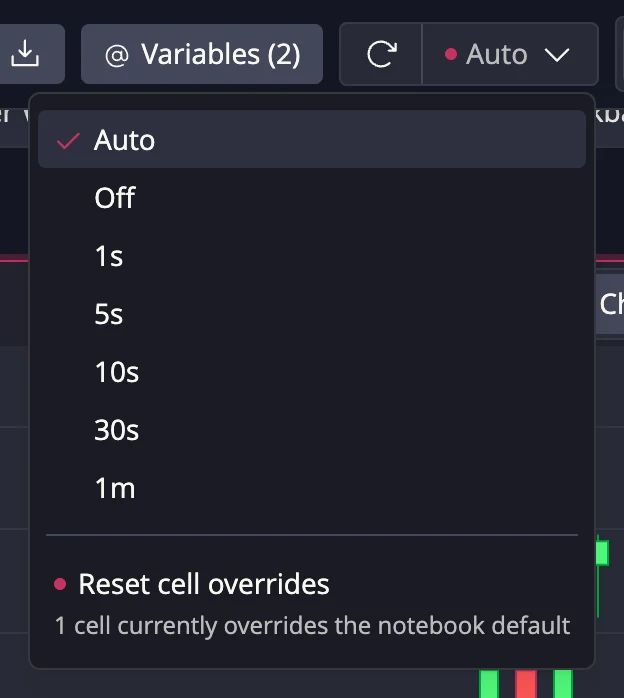
The Refresh charts split button on the toolbar refreshes every chart immediately; it is disabled when the notebook has no chart cells. Its dropdown sets the default interval: Auto (the default), Off, 1s, 5s, 10s, 30s, or 1m.
Per-cell overrides
A chart cell's own interval dropdown (or Auto-refresh in its ⋮ menu) offers the same options, plus Notebook default to remove the override. A cell uses its own setting if set, otherwise the notebook default. Overridden cells are marked with a pink dot, and so is the toolbar control; when overrides exist, the toolbar dropdown gains Reset cell overrides.
How Auto works
Auto adapts the interval to how long your queries take: fast queries refresh often, slow ones back off. Charts only poll while they are visible: scrolled into view and with the browser tab in the foreground. They catch up as soon as you return. Off still draws the chart once, and a manual refresh always goes through.
Example: a live trading dashboard
The dashboard pictured above, built on the demo trades table:
-
Add a markdown cell as the title, and define
@symbol := 'BTC-USDT'and@window := '$now - 1h..$now'under Variables. -
Add the price cell. Two statements in one cell draw candles with volume bars behind them; assign the volume query to the right axis in Chart settings and cap that axis so the bars stay low:
1-minute candles and volume for the last hourSELECT timestamp, first(price) AS open, max(price) AS high,
min(price) AS low, last(price) AS close
FROM trades
WHERE symbol = @symbol AND timestamp IN @window
SAMPLE BY 1m;
SELECT timestamp, sum(amount) AS volume
FROM trades
WHERE symbol = @symbol AND timestamp IN @window
SAMPLE BY 1m; -
Add the supporting cells, pressing Draw on each: buy vs sell volume as a stacked bar (
sum(amount)sampled by 5 minutes, partitioned byside), price vs a running session VWAP as two lines, and a per-symbol trade count partitioned bysymbol. -
Switch to the grid layout, arrange the cells, and hide the editors with the Split/maximize view toggle.
-
Set the notebook auto-refresh default to 1s.
A coding agent connected over MCP can build this whole dashboard from a single prompt. So can the built-in AI Assistant, with no coding agent needed.
Next steps
- QuestDB MCP server lets a coding agent build this whole dashboard from a single prompt
- Notebook charts covers chart types, settings, and combining queries
- Managing and sharing notebooks covers exporting the dashboard to share it