Notebook cells
A notebook is a stack of cells. SQL cells hold queries and their results; markdown cells hold notes, titles, and commentary. Every cell has a header with its name and controls, and cells can be named, reordered, resized, duplicated, and focused individually.
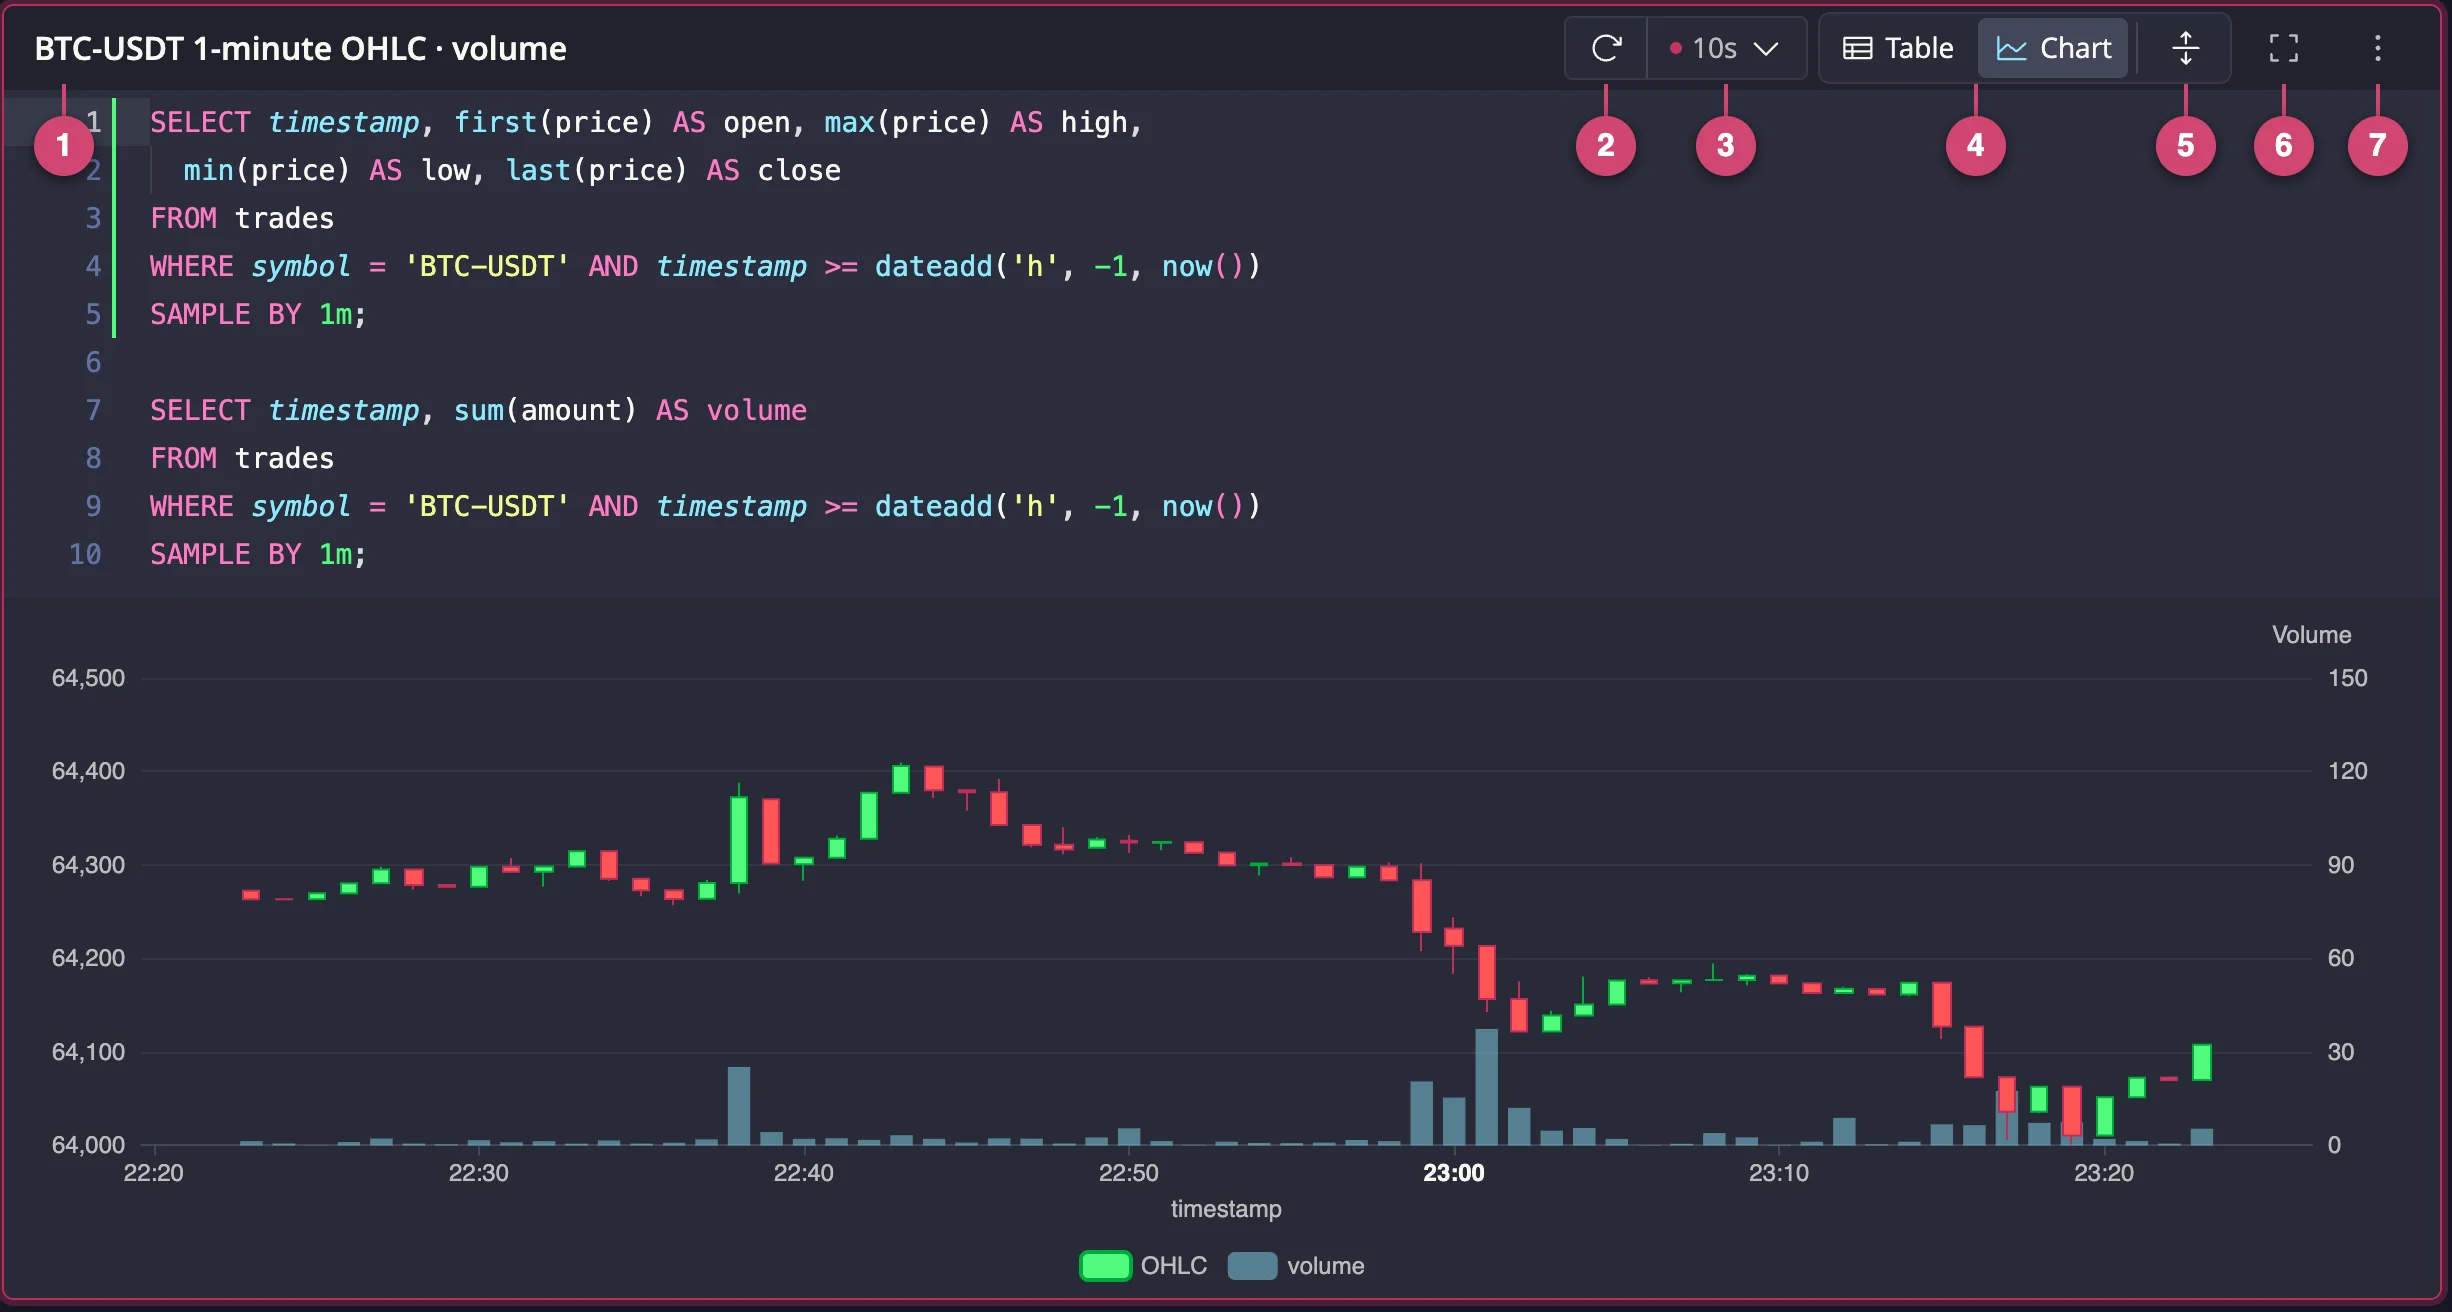
- Cell name: doubles as the chart title. See Naming cells.
- Refresh now: re-runs the chart on demand.
- Auto-refresh interval: this cell's refresh schedule; the dot marks an override of the notebook default. See Live dashboards.
- Table | Chart: flip between the two views of the same result.
- Split/maximize view: shows or hides the editor within the cell.
- Maximize: expands the cell to fill the whole notebook.
- More actions: see the cell menu reference.
Adding cells
Use Add Cell for a SQL cell or Add Markdown for a markdown cell. Both buttons sit at the end of the notebook, and in the list layout they also appear between cells when you hover over the gap.
Running SQL
Running a statement
Press Run in the cell header, or Ctrl/Cmd+Enter inside the editor, to
run the statement under the cursor. If text is selected and the
Run with selection editor
setting is on, the selection runs instead. Ctrl/Cmd+Shift+Enter runs every
statement in the cell. A running query shows a Stop button in its status
line, and you can keep editing while it runs.
Multiple statements
A cell can hold several statements. In table mode they run sequentially, top to bottom, and stop at the first error; in chart mode they run in parallel and do not block each other (see Table and chart views).
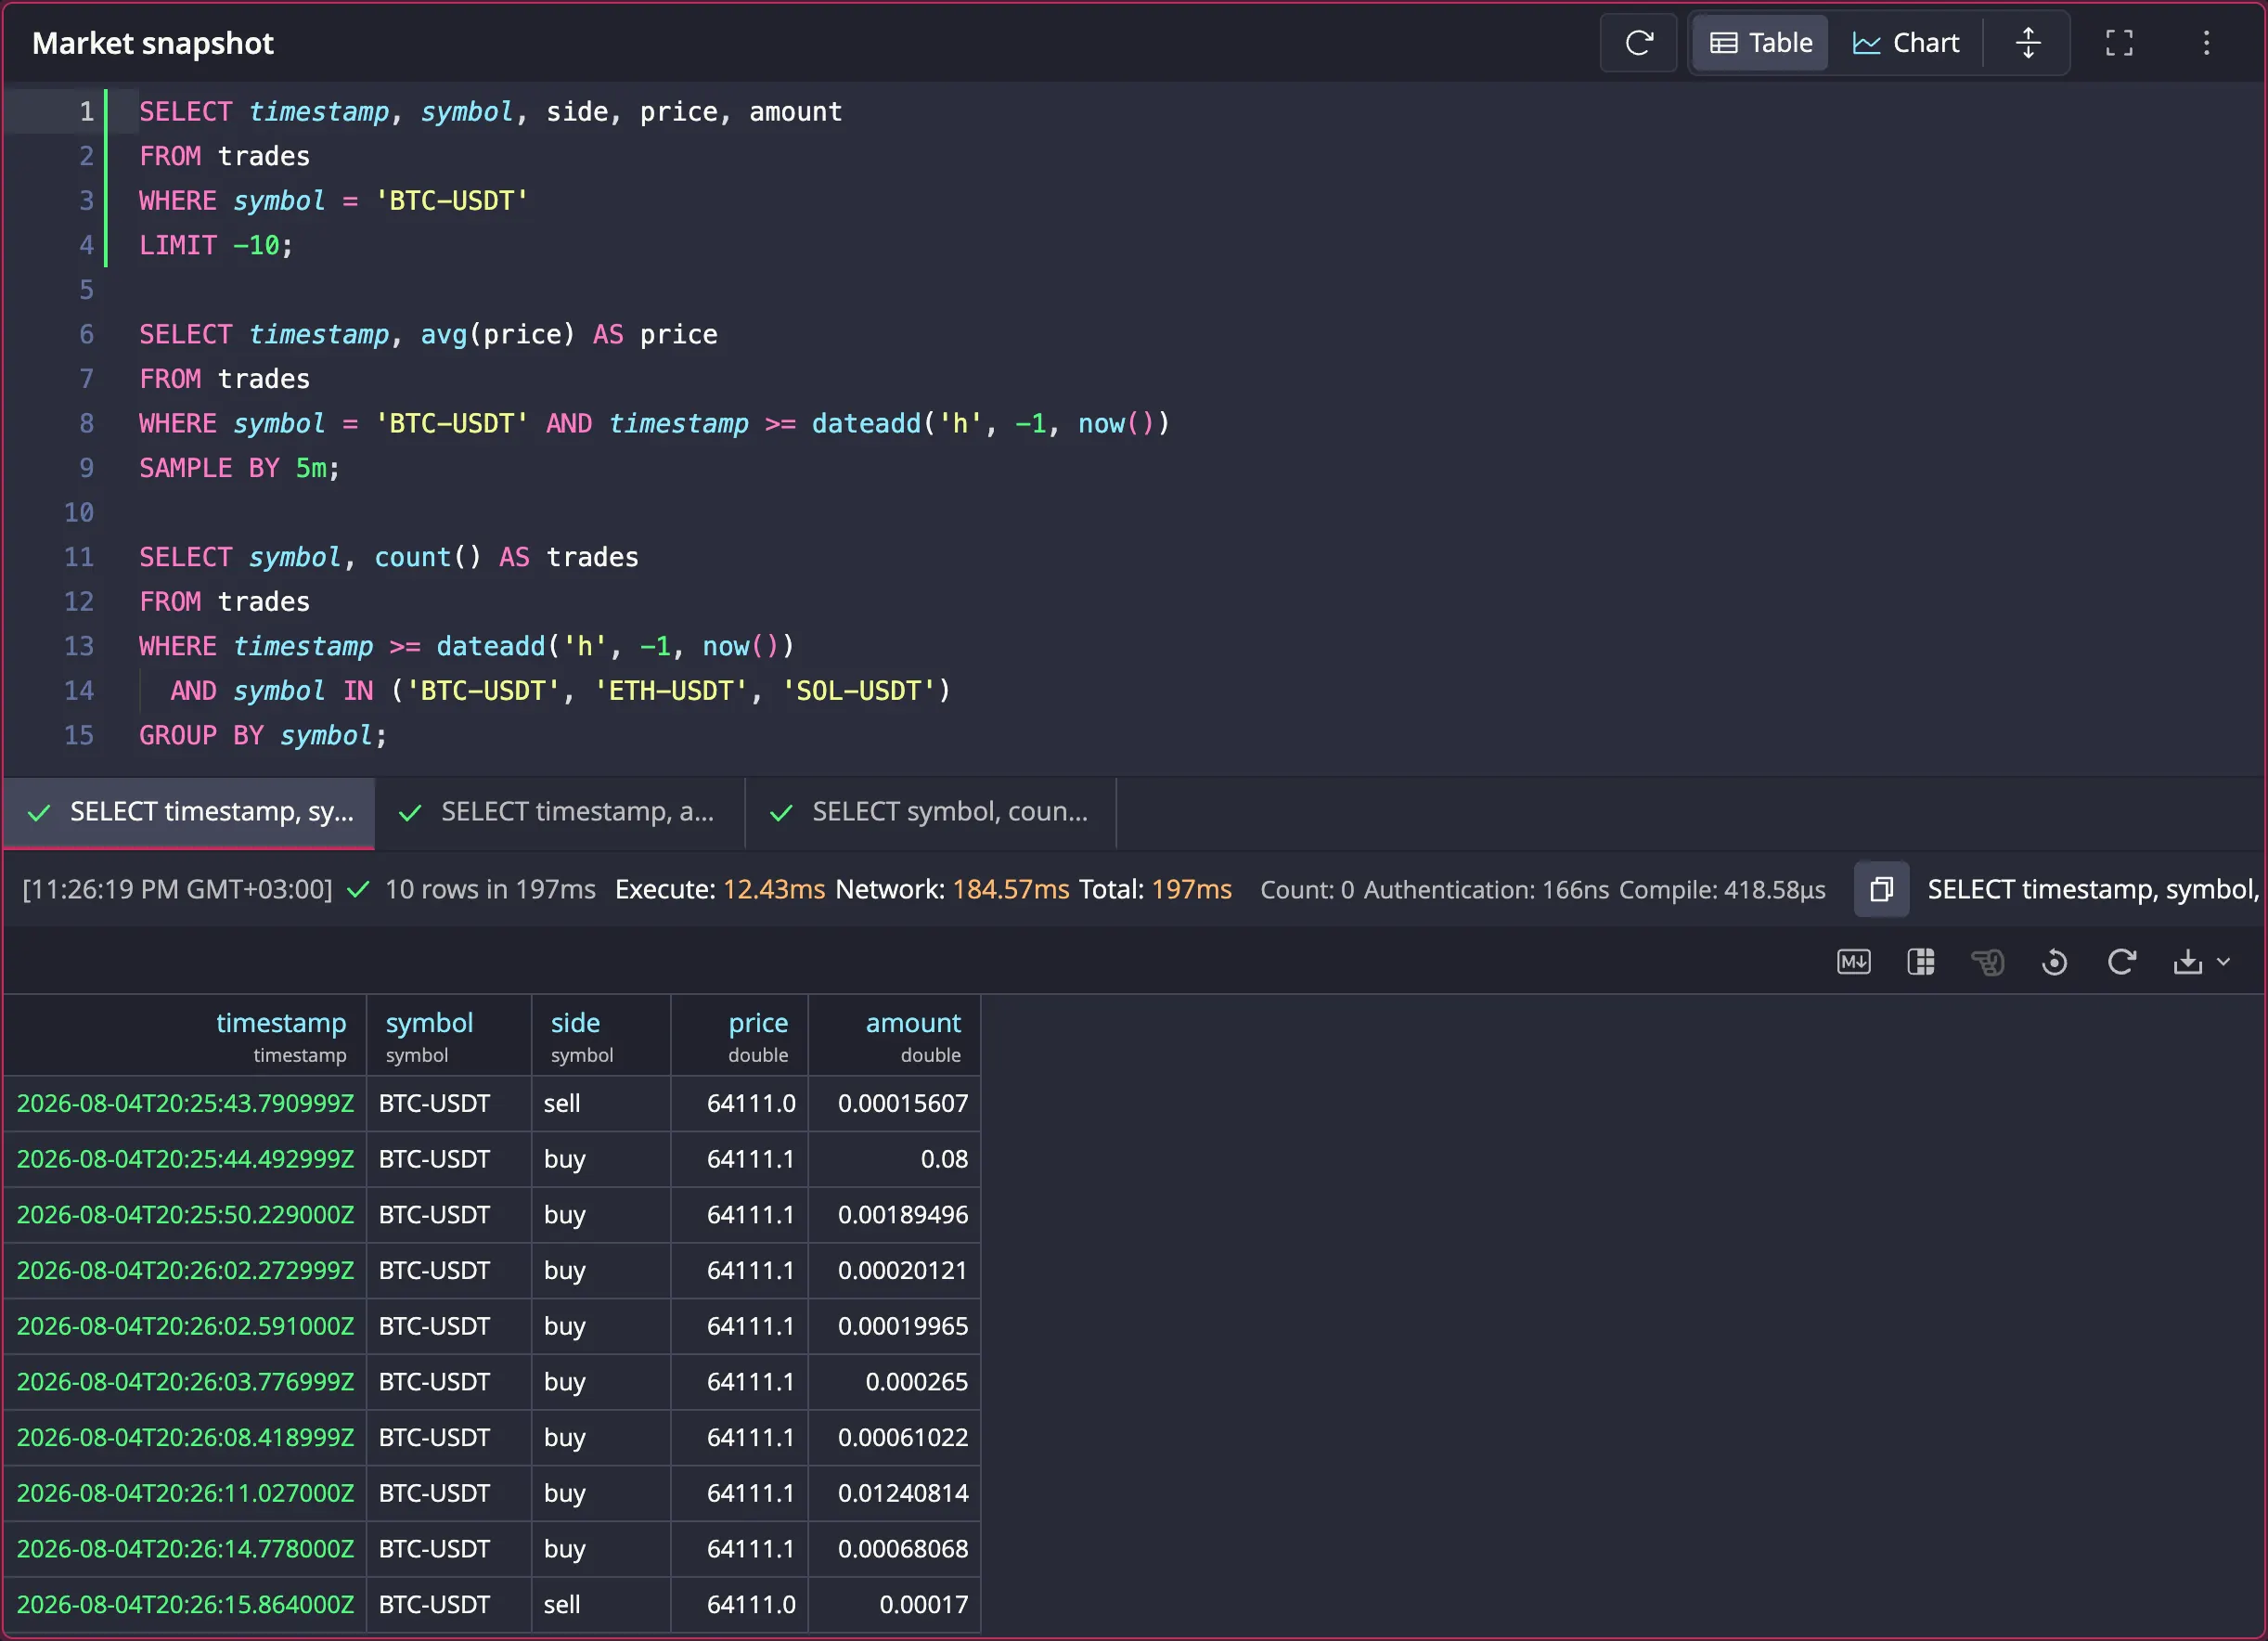
When a cell has more than one statement, each gets its own result tab with a status icon: queued, running, success, error, or cancelled. While a run is in progress the active tab follows the executing statement until you click a tab yourself.
Results in a cell
Results render in the same grid as the editor's Result Grid, with the same column resizing, reordering, freezing, and keyboard navigation. The actions bar above the grid offers: copy the result as a markdown table, freeze the left column, move the selected column to the front, reset the grid layout, re-run the active tab's query, and Download as Parquet / CSV.
Each statement fetches up to the per-statement row cap (see Storage and limits); larger results show "N of M rows (truncated)". Results and your grid layout are saved with the notebook and restored when you come back to it.
Table and chart views
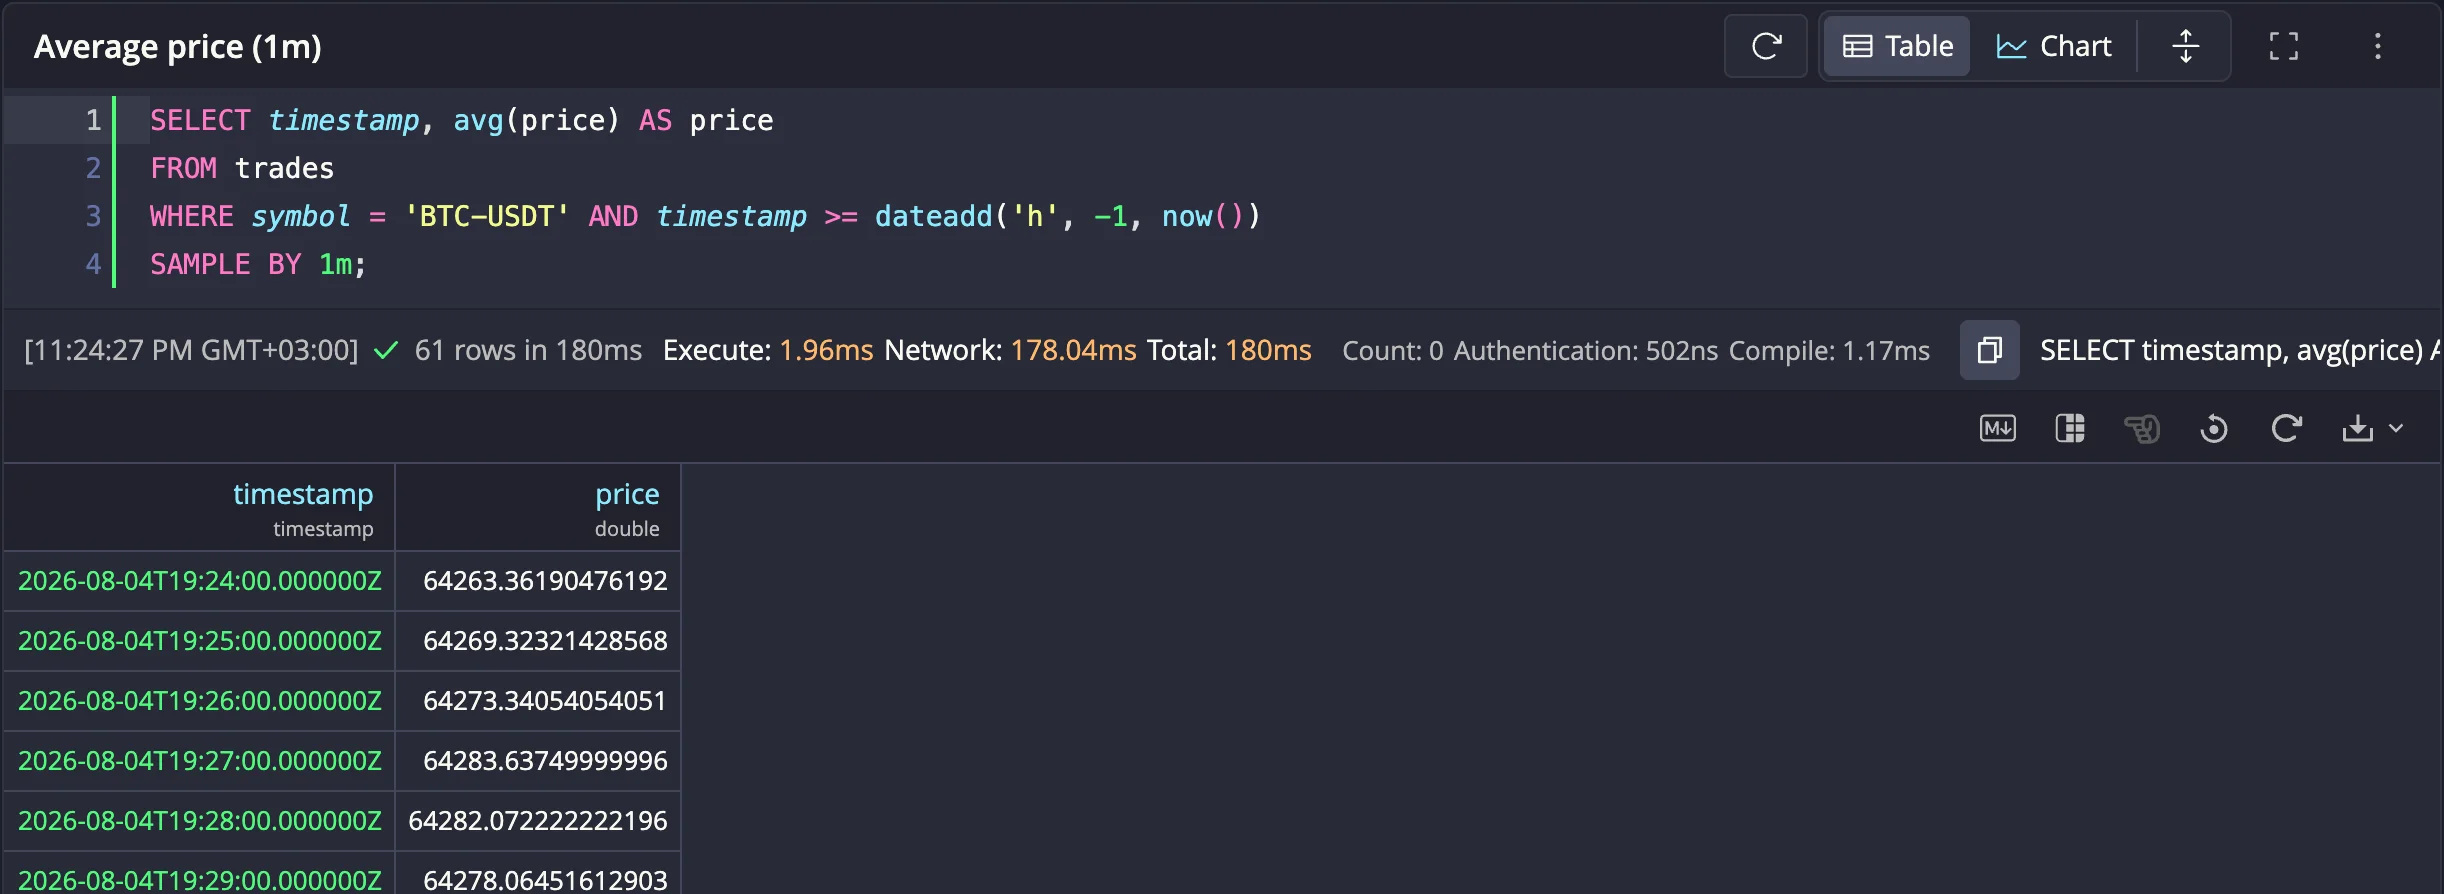
Before a cell has a result, its header shows Run and Draw. Once a result exists, a Table | Chart toggle replaces them. Clicking the already-active view clears the result and collapses the cell back to just the editor.
The same query, in each view:
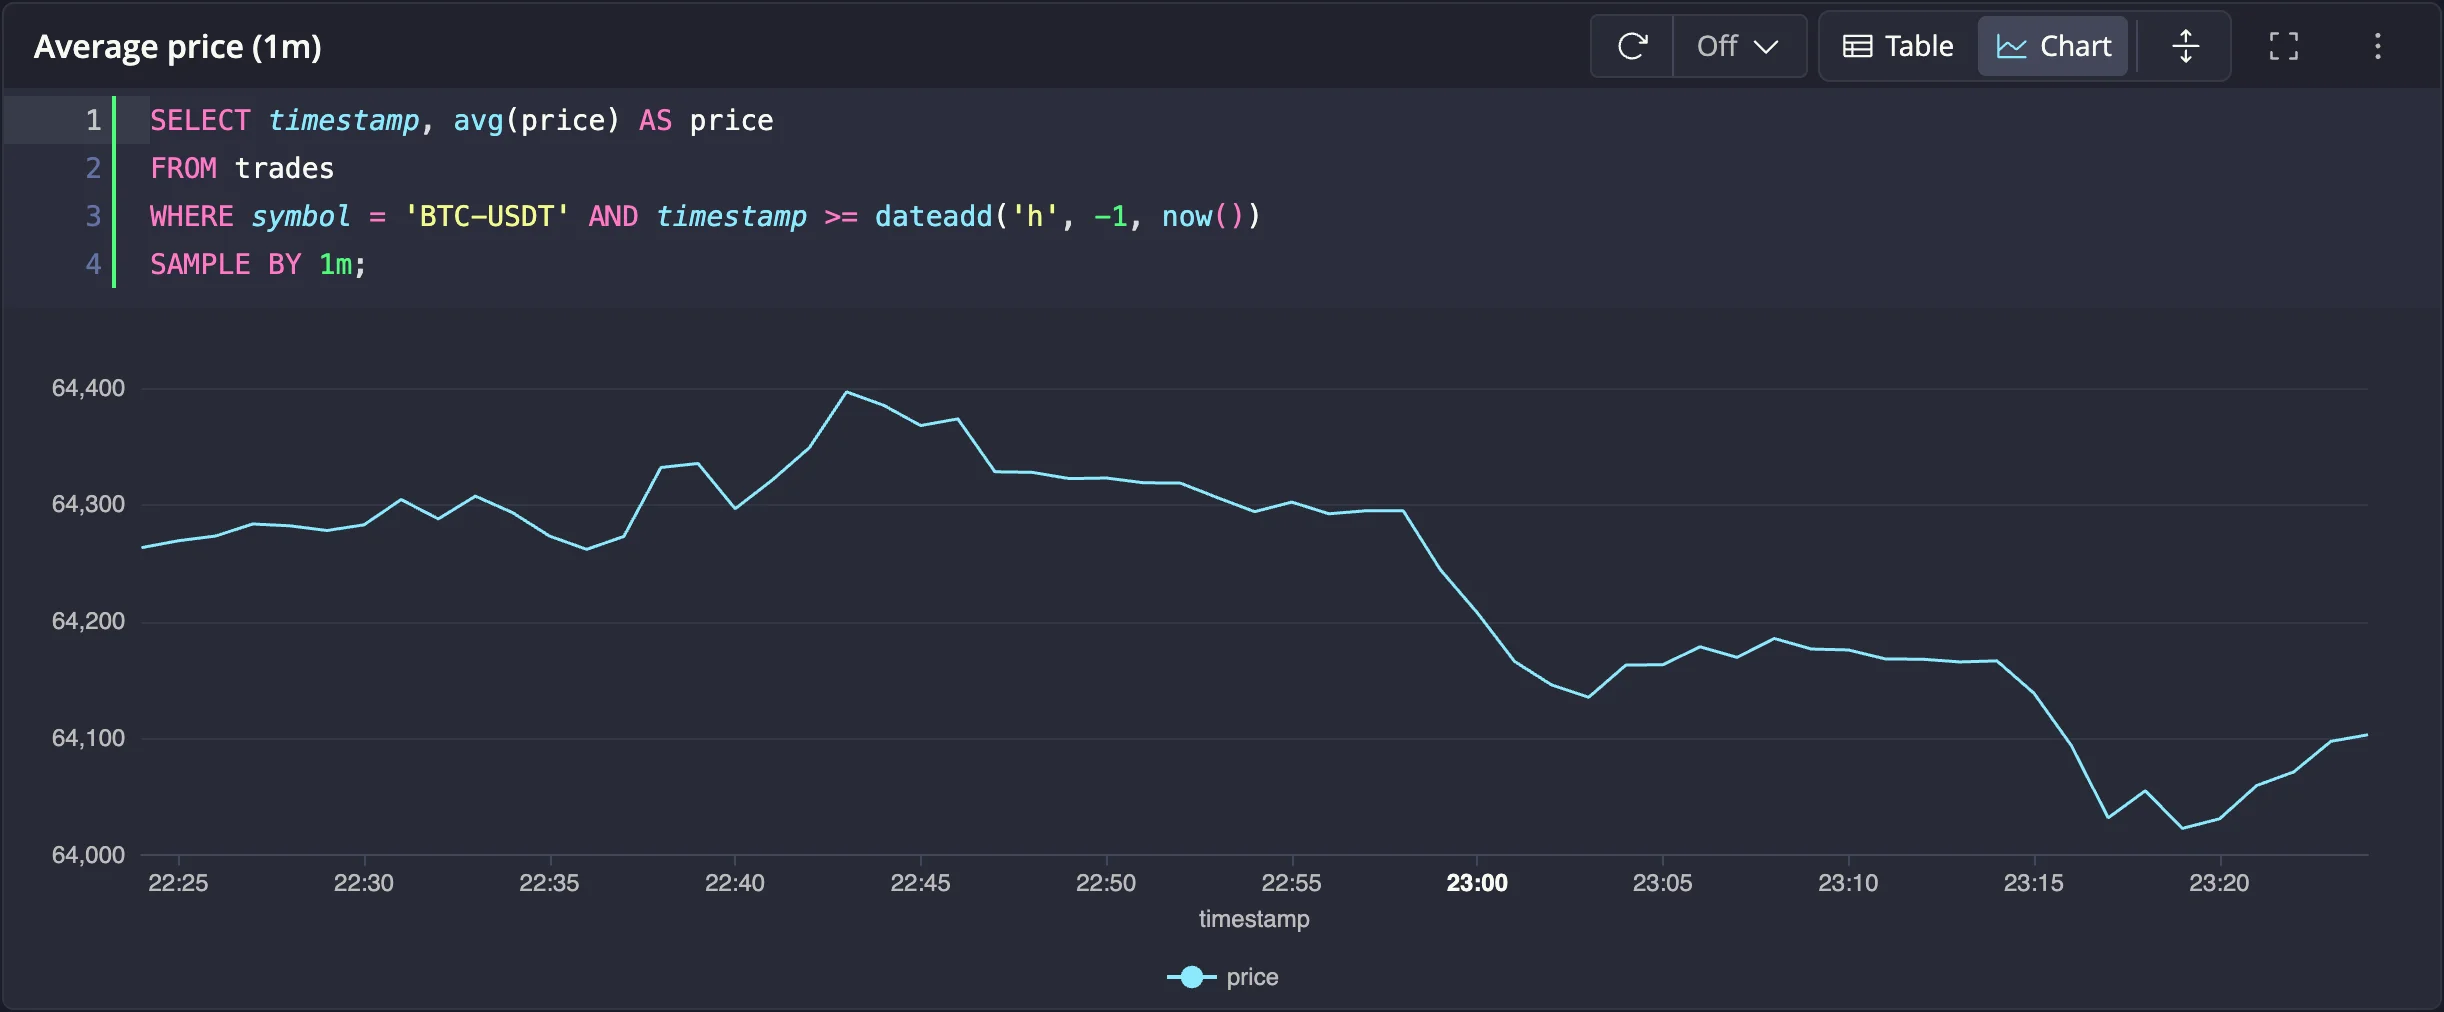
Drawing charts is covered on the Charts page.
Markdown cells
Double-click a markdown cell (or use its Edit button) to edit the source.
Save with Apply, Ctrl/Cmd+Enter, or by clicking elsewhere.
Markdown cells render headings, lists, links, code, tables, quotes, and emojis. Use them for dashboard titles and commentary.

Naming cells
The label on the left of the cell header reads "Untitled" until you name the cell. Double-click it (or press Enter with the label focused) to rename, up to 100 characters. Pressing Enter or clicking away saves; Escape cancels; an empty name clears it.

Organizing cells
In the list layout, reorder cells with Move up / Move down in the cell menu, or press the arrow keys with the cell focused. In the grid layout you drag cells by their headers instead:
Resizing a cell
In the list layout, drag the divider between the editor and the result to rebalance them, or drag the cell's bottom edge to change its overall height. Double-click a handle to reset it. The editor grows with your SQL until you resize it manually; after that, your chosen height sticks and the editor scrolls internally.
In the grid layout, cells resize from their edges and corners instead, and neighboring cells reflow to make room. Double-click a left or right edge handle to expand the cell as far as it can go toward that side, or double-click the cell's header to make it full-width:
Focus modes
Maximize a cell
The Maximize button expands the cell to fill the entire notebook, hiding the toolbar and all other cells, which is useful for working on one query without distraction. Restore brings the notebook back.
Split/maximize view
The small arrows icon beside the Table | Chart toggle (tooltip Maximize view) hides the SQL editor so the table or chart fills the cell. Unlike maximizing a cell, the cell's footprint in the notebook does not change. Click it again (Split view) to bring the editor back. This is the main tool for clean dashboards, where cells show only their charts.
Narrow cells collapse the editor automatically and move their actions into the ⋮ menu. Use View SQL there to reveal the editor.
Cell menu reference
The ⋮ menu on each cell shows the actions that are not already visible as buttons at the cell's current width:

| Item | Purpose |
|---|---|
| View SQL / View table / View chart | Switch what a narrow cell displays |
| Reset zoom | Reset a zoomed chart. See Charts |
| Auto-refresh | Per-cell refresh interval. See Live dashboards |
| Refresh now | Re-run the cell or refresh its chart |
| Chart settings | Open the chart configuration drawer. See Charts |
| Move up / Move down | Reorder the cell (list layout) |
| Duplicate | Copy the cell below the original |
| Delete | Remove the cell |
Next steps
- Notebook charts covers drawing and configuring charts
- Live dashboards arranges cells into an auto-refreshing grid
- Managing and sharing notebooks covers renaming, duplicating, and exporting notebooks