Lies, Damn Lies and Database Benchmarks
Benchmarks, everyone loves benchmarks. People look at a benchmark result and start spreading the word that database X is the top dog, since it is so much faster than database Y.
A decent benchmark might be pictured as a strict Olympic Games-like running competition where the "Citius, Altius, Fortius" principle is precisely implemented. But in reality, when you approach the athletes, you start hearing unexpected noises. What is that? It turns out the competition is more like those weird contests you find on the Internet: the athletes must whistle "Yellow Submarine" accurately while running as fast as they can. The winner is no longer the fastest runner. It is whoever best balances raw speed against a skill that has nothing to do with running, and the quickest sprinter on the track can easily finish last.
That analogy applies to a thing as complex as database benchmarks, especially when quite different categories of databases are being compared. A perfect, completely fair database benchmark is like a unicorn: good luck finding one. Today we will try to illustrate this by toying with a public, well-recognized benchmark.
The benchmark we will use is ClickBench, but do not get us wrong: we are here to question all database benchmarks, not ClickBench specifically. ClickBench is just convenient. It is a solid comparison for analytical databases and already includes a large roster of engines.
How ClickBench measures things
ClickBench runs the same workload against every system: a single web-analytics
table of around 100 million rows and 105 columns (the famous hits dataset),
and 43 analytical queries over it. Each engine ships a small set of shell
scripts. The flow is always the same: a script installs the database, loads the
data (importing from CSV/TSV, or simply pointing the engine at a downloaded
Parquet file if it can read external files), and then runs the 43 queries.
Each query is measured in two flavors:
- Cold run. This is the first execution of a query, with all operating system page caches and database caches cleared beforehand. It captures the worst case, when nothing is warm.
- Hot run. Quoting the ClickBench rules, "each of the 43 queries is run three times," and "the smaller of the 2nd and 3rd runtime is used if both runs are successful." The first run is supposed to populate the caches, so the two later runs are expected to be the fastest.
That cold definition hides an asymmetry the public dashboard does not advertise.
Clearing the OS page cache and restarting the server is only possible when the
database runs on the benchmark machine. A managed cloud service, say Snowflake,
BigQuery, Redshift, or Databricks, runs on the provider's hardware, where the
harness has no shell, no drop_caches, and no way to bounce the server, so its
three runs all hit the same live, never-restarted service. Its cold number is
therefore never forced cold the way a self-hosted engine's is, which tilts the
cold-run ranking toward hosted systems, and with it the combined score that folds
cold runs in. ClickBench's rules require that restart for a true cold run, and a
restart is something you can only ask of a server you control. Every engine in
this post runs self-hosted on the same box, so they all play by the same rule,
but it is worth remembering the next time you compare cold-run numbers across
hosted and self-managed systems.
We will focus on hot-run results only. We will not compare individual queries either, only the overall score. The score is the one the public dashboard shows: for each query, ClickBench computes a ratio against the fastest system on that query,
ratio = (0.01 + hot_time) / (0.01 + baseline_time)
where baseline_time is the best hot time among the compared systems for that
query. The 0.01 is a 10 ms cushion that stops sub-10 ms queries from
dominating. The final score is the
geometric mean of those ratios
across all 43 queries. Lower is better, and a hypothetical 1.000 would mean "fastest on
every single query." A failed query is penalized heavily. The full results for
everything below live in the support repository linked at the end, so you can
re-score them yourself.
INFO
Here is the subtlety that drives this entire post. Every ClickBench query
script records the engine's own internal query time: DuckDB's Run Time,
ClickHouse's --time, DataFusion's Elapsed, QuestDB's
timings.execute, Polars' internal elapsed. Process and client startup is in nobody's recorded
number. So keeping a process alive cannot change the score by removing a startup
term, because that term was never in the number to begin with. It can only
change the score through process-local cache warmth. Keep this in mind, it
matters later.
The test stand
ClickBench's reference runs use a c6a.4xlarge VM in AWS. Ours do not. Every
number in this post was measured on a single box:
AMD Ryzen 9 7900 (12 cores / 24 threads, up to 5.49 GHz, 64 MiB L3), 61 GiB RAM, NVMe SSD, Ubuntu 24.04, with decent cooling and therefore fairly stable performance.
Because the hardware differs, do not compare our absolute numbers to the public ClickBench dashboard. The only thing that matters here is the re-ranking within our box, where every engine sees the exact same machine. And the most trustworthy number is always the one you measure on your own machine.
The contenders
A benchmark is not reproducible, or fairly judgeable, without exact versions, and these move fast. Here is precisely what ran:
| Engine | Version | Notes |
|---|---|---|
| DuckDB | 1.5.4 | matches upstream (installs latest) |
| ClickHouse | master 26.6.1.909 | matches upstream (its installer pulls master) |
| DataFusion | 53.1.0 | upstream pin, built from source |
| Salesforce Hyper | tableauhyperapi 0.0.25080 | latest on PyPI, both sides |
| Polars | latest on PyPI at run time | not pinned upstream |
| CrateDB | 6.3.3 | upstream pins 5.10.10; we bumped to latest stable |
| QuestDB | 9.4.3 | upstream pins 9.3.1; we bumped, see below |
Two deliberate deviations from upstream's pins: CrateDB, because upstream's apt
install pulls the latest stable anyway (6.3.3), and QuestDB, because version
9.3.1 trips over ClickBench PR #902.
That PR documents two real bugs: 9.3.1 lacks the length_bytes() function
(added in 9.3.2), so queries 27 and 28 do not finish, and it predates the
query.timeout.sec to query.timeout config rename, so the timeout bump
silently does nothing. We moved to 9.4.3, the latest at run time, which fixes
both. The exact versions resolved for the two unpinned engines, Polars and Hyper,
are recorded in the support repository next to the results, so the whole run stays
reproducible.
Scenario 1: the Parquet tiling competition
Let's start simple. There is a single Parquet file holding the dataset (about 14 GB), and we need to query it. We picked five engines that all read external Parquet directly: DuckDB, Polars, ClickHouse, DataFusion, and Salesforce Hyper. Four of them spin up a fresh CLI or Python process for each query invocation. Polars is the exception: ClickBench drives it as a long-lived Python session, which will matter in a moment.
Here is the vanilla ClickBench result on our box:
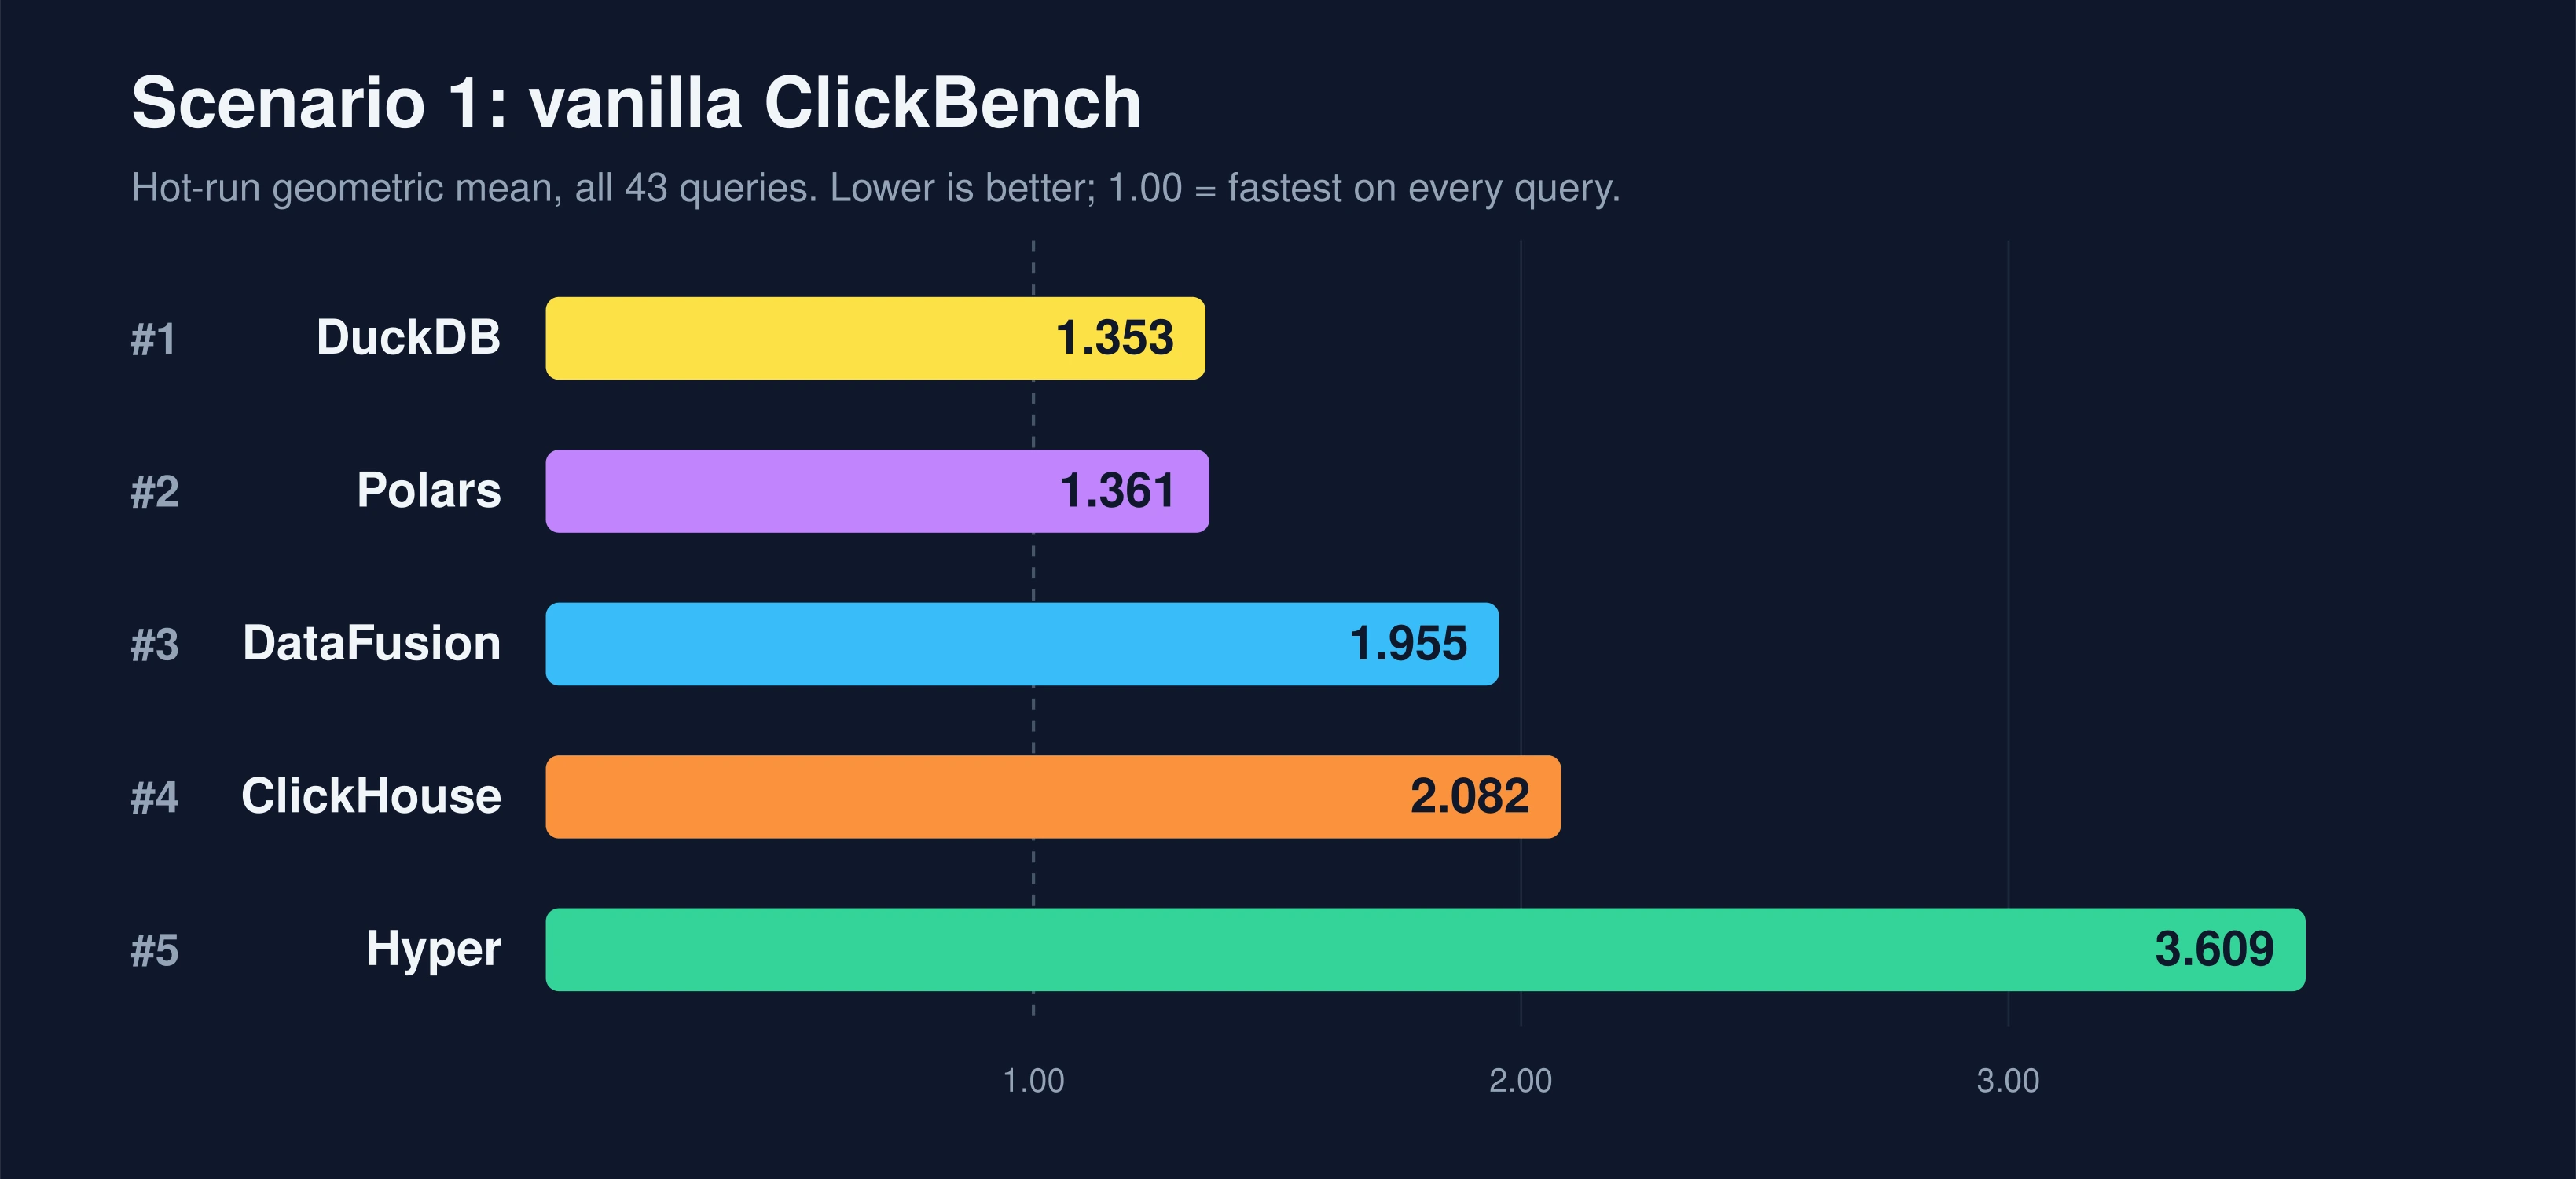
| rank | system | hot score |
|---|---|---|
| 1 | DuckDB | 1.353 |
| 2 | Polars | 1.361 |
| 3 | DataFusion | 1.955 |
| 4 | ClickHouse | 2.082 |
| 5 | Hyper | 3.609 |
All five are strong engines, but some are noticeably faster here. DuckDB and Polars lead the pack and are nearly tied, DataFusion and ClickHouse sit in the middle, and Hyper trails well behind. Case closed?
The elephant in the room
Is it actually fair to restart the CLI or Python process on every single query
execution? This is an open question, and it is the subject of
ClickBench issue #936,
titled "Salesforce Hyper: Hot runs are measuring cold times." As the issue puts
it, the query script "actually restarts the server from scratch in every
iteration," so the runs labeled hot are, for some engines, really cold starts.
In real life, an analyst opens a DuckDB CLI session or an interactive notebook and keeps it around. The process stays warm. That is also how traditional client-server databases are always measured, since the server simply does not go anywhere between queries. So why don't we change exactly one thing and re-measure?
The tweak: keep each engine's process alive across the repeated runs, feeding it queries through a long-lived session (an engineer who left their REPL open). We change nothing else. The timing method stays each engine's own internal number, the data stays the same Parquet file, and the queries are byte-for-byte identical. Only persistence changes. The harness for this is in the support repo.
One note on the per-engine speedups quoted below before the play-by-play. Each is that engine's own query time improving: the per-query geometric mean of its original time over its keep-alive time. That is a different measurement from the scores on the bars, which rank each system against the fastest one per query. So a speedup will not equal the ratio of an engine's two bars, and an engine can even post a speedup while its score gets worse, as we are about to see.
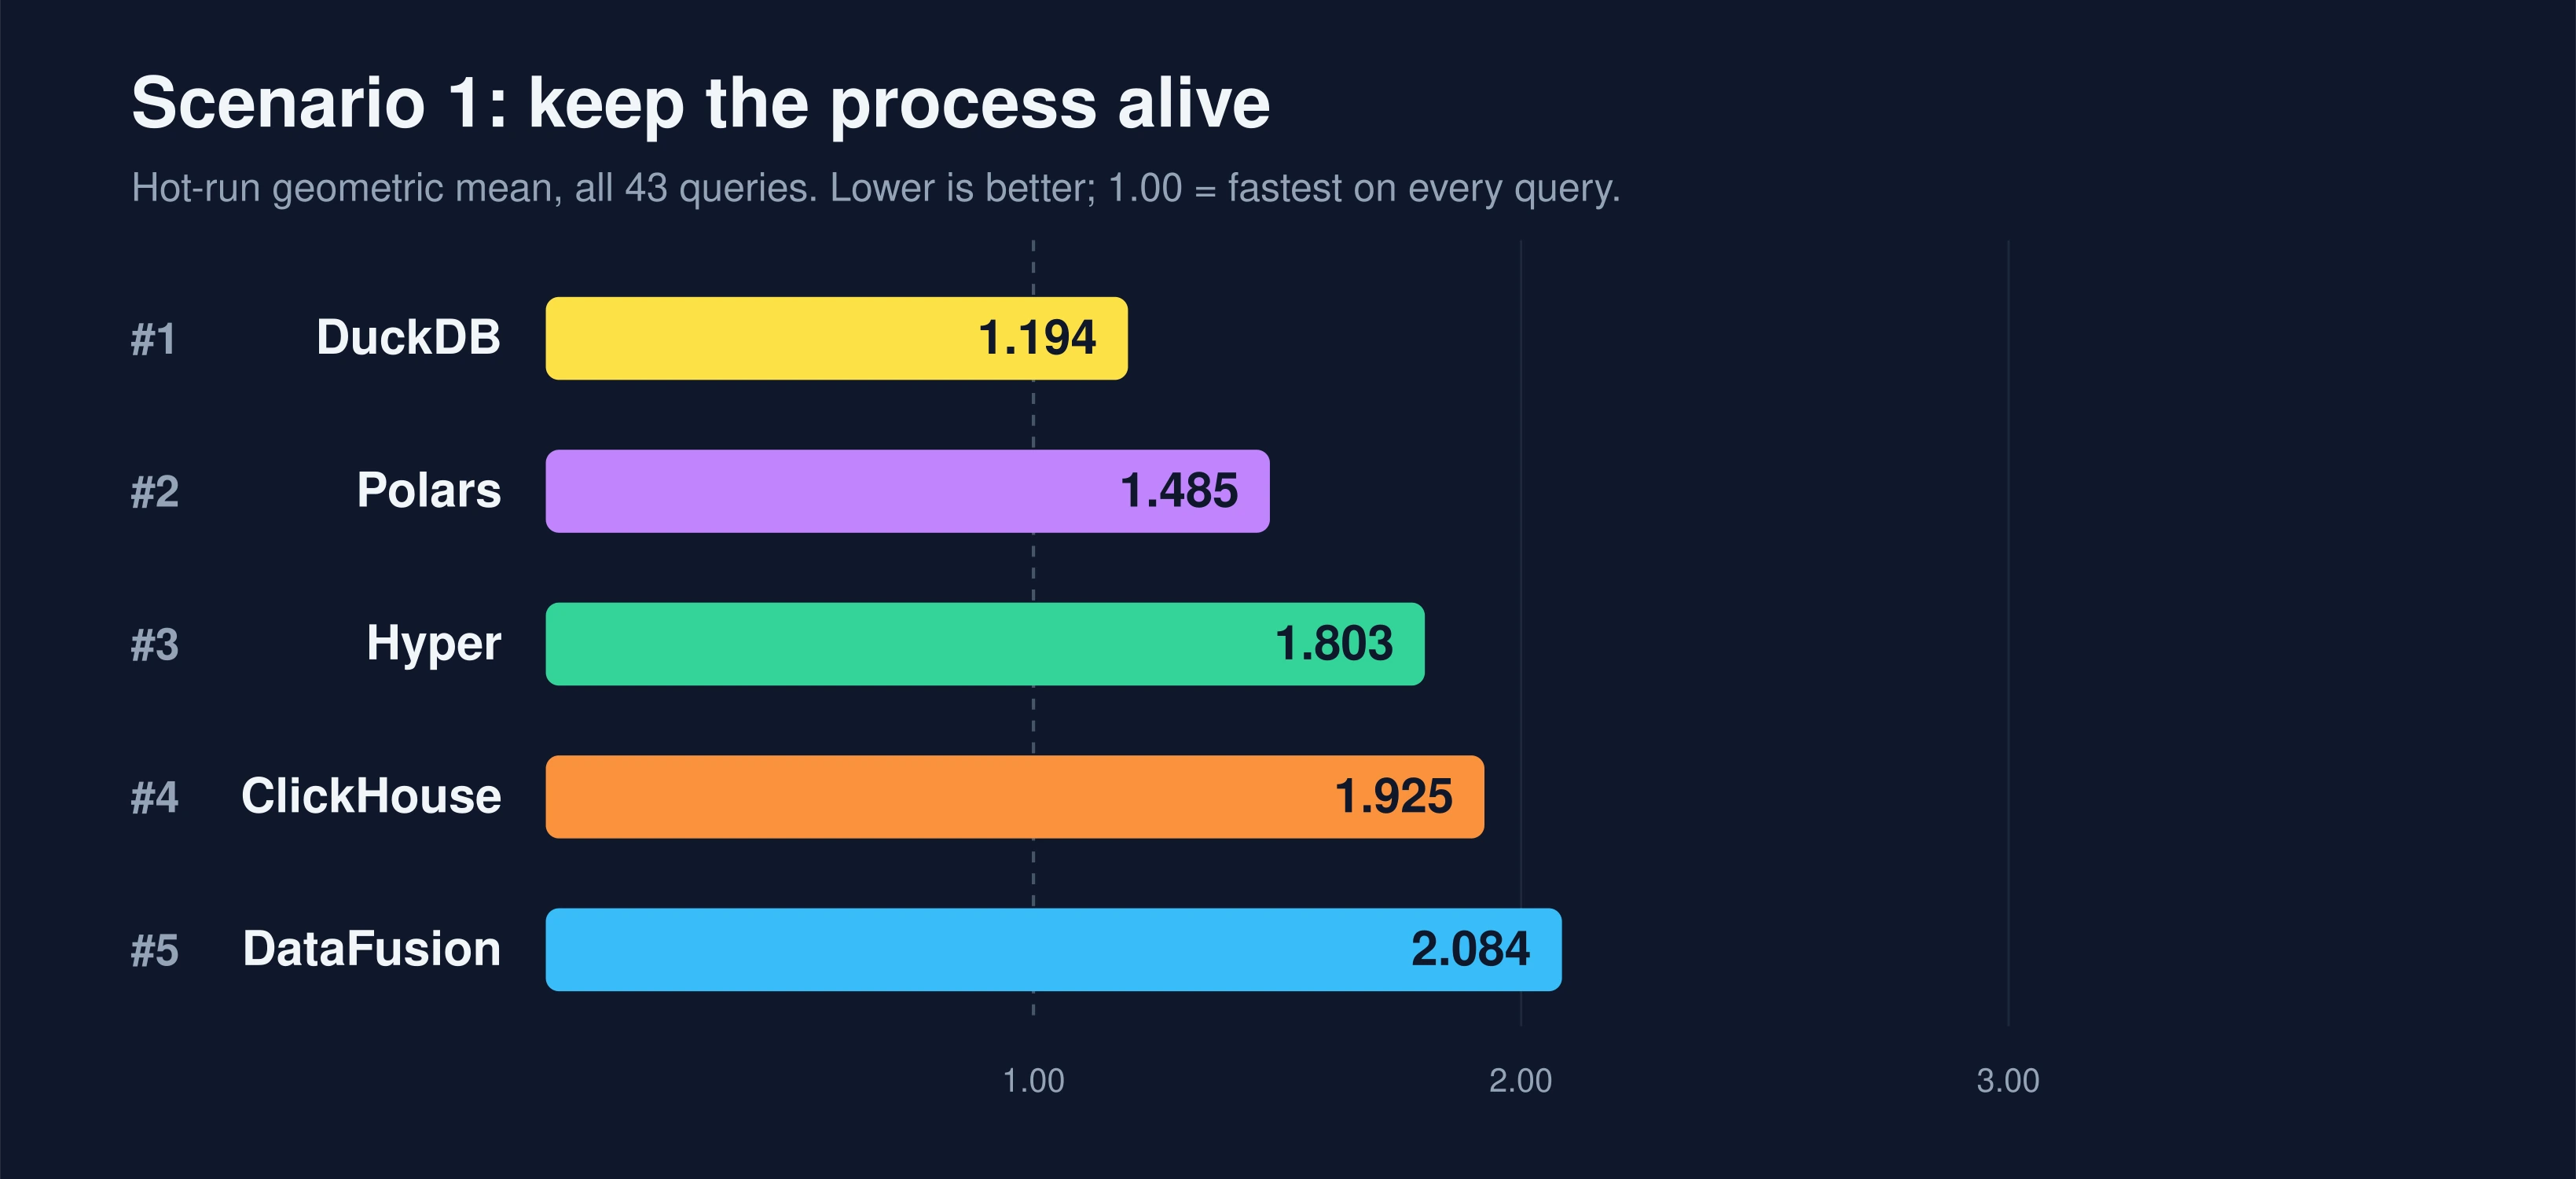
Look what happened to Hyper. It went from dead last to third, the single biggest mover on the board (2.17x faster on the geometric mean). This one surprised us. We had confidently predicted Hyper would be the inert control of the experiment: its per-call process spawn and table setup happen outside the timed region, so keeping it alive "should not" change the recorded number at all. We were wrong. The timed query execution itself carries first-query costs in a fresh process: query compilation, a cold buffer pool, Parquet metadata warmup. Those evaporate once the process persists, and they were never the startup term we assumed was excluded. The lesson: even when we think we understand exactly where a benchmark spends its time, a fresh process can hide warmup inside the part being measured.
DuckDB stayed on top and got faster too (1.24x). Its create.sql enables
parquet_metadata_cache, a cache that a fresh-process-per-query harness can
never actually populate. ClickBench turns on a cache that its own driver
defeats. Give DuckDB a persistent process and that cache finally does its job.
Now look at the bottom. DataFusion barely moved (1.03x), so it sank from third to last. It did not get slower in absolute terms. Everyone around it simply pulled away, and a ranking is relative.
The clearest illustration of that last point is Polars. Polars is byte-for-byte identical in both runs. ClickBench already drives it as a persistent session, so our tweak does literally nothing to it (1.00x). And yet its score got worse, from 1.361 to 1.485, and it dropped from a near-tie for first to a clear second. Why? Because the score is a ratio against the fastest system per query, and the systems around Polars got faster. The baseline moved underneath it. A database can score worse on this benchmark while executing the exact same work in the exact same time. Hold that thought, we will see it again.
INFO
Two of these engines, ClickHouse and DataFusion, do not have a CLI that cleanly
holds a session open over a pipe, so their keep-alive variants use the engine's
embedded library held resident: chdb (which is ClickHouse-local as a library)
and datafusion for Python. The bundled engine version in those libraries can
differ slightly from the vanilla CLI, so there is a small version skew on those
two between the original and keep-alive runs. DuckDB and Hyper keep the
identical binary on both sides.
External files are great. But how about data in native format?
Scenario 2: let everyone warm up
For the second scenario we switch to native storage, where each engine loads the data into its own on-disk format first. The contenders: DuckDB, ClickHouse, QuestDB, and CrateDB. We picked engines whose vanilla scores sit close enough that a single fair tweak can plausibly reorder them, since a comfortable runaway leader would not budge no matter what we changed. CrateDB is the exception. It scores nowhere near the others, but it earns its seat by giving us a second JVM engine alongside QuestDB, so the warmup effect we are about to show does not rest on QuestDB alone.
The mix also splits on compiler strategy. DuckDB and ClickHouse are written in C++ and lean on ahead-of-time compilation. QuestDB and CrateDB run on the JVM (QuestDB mixes Java with native code in C++ and Rust), where a JIT compiler optimizes hot code paths as the process runs. That difference is about to matter.
There is a second split worth noting up front. ClickHouse, QuestDB, and CrateDB are client-server databases, so their server process stays resident between queries by nature. DuckDB is embedded, and under ClickBench it spins up a fresh process for every query, exactly as it did in Scenario 1. That is why, two tweaks from now, DuckDB will be the only engine we have to deliberately keep alive.
First, the vanilla ClickBench result:
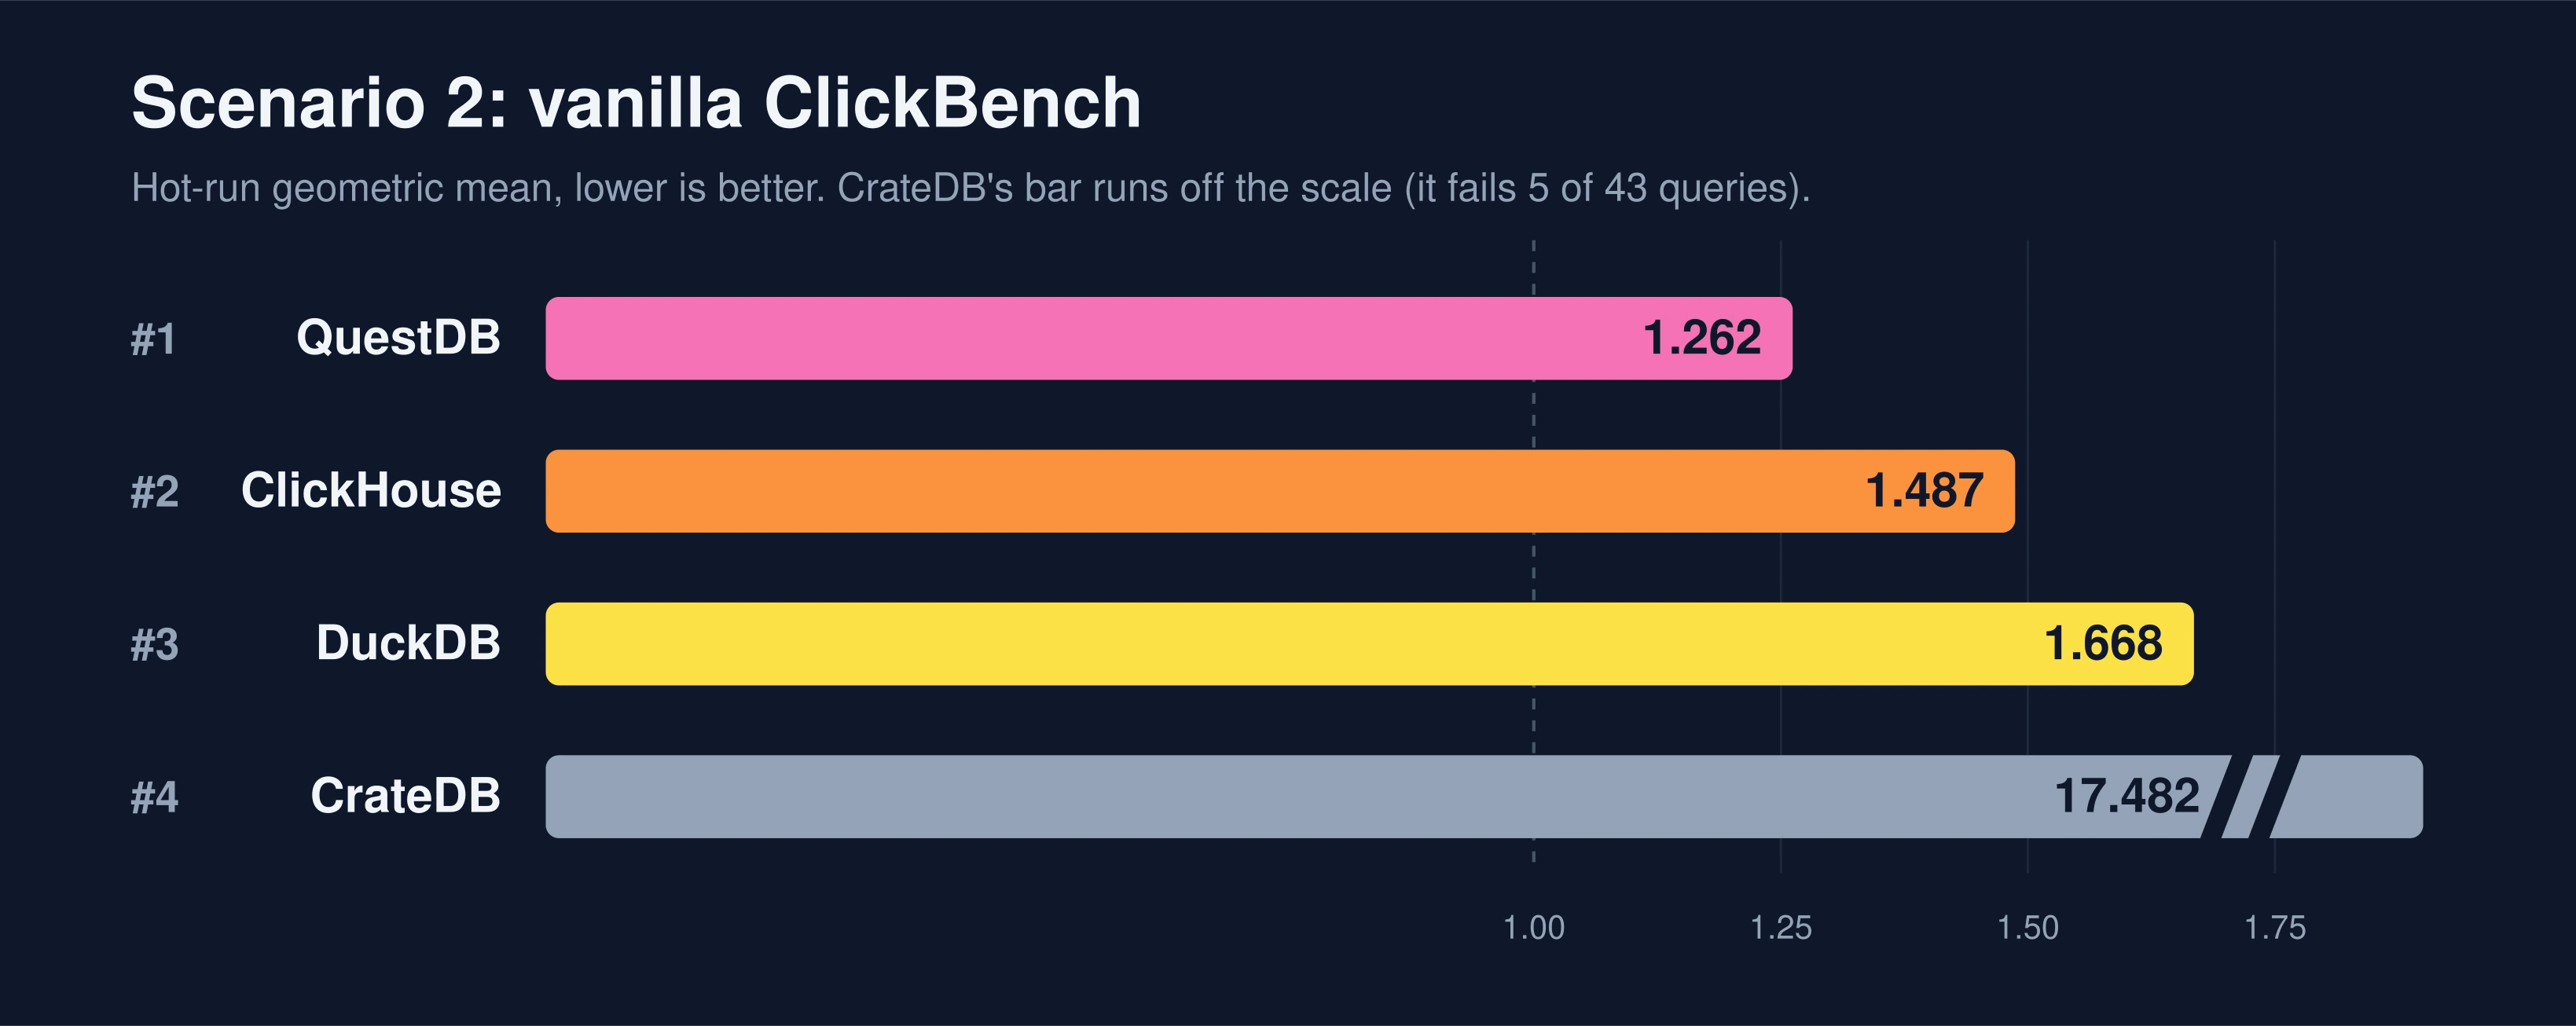
| rank | system | hot score |
|---|---|---|
| 1 | QuestDB | 1.262 |
| 2 | ClickHouse | 1.487 |
| 3 | DuckDB | 1.668 |
| 4 | CrateDB | 17.482 |
QuestDB is on top here, ClickHouse second, DuckDB third. CrateDB sits far behind
at 17.482, its bar running clean off the scale we use for the close race at the
top. That is not a rendering trick: it fails 5 of the 43 queries on this box,
throwing its own CircuitBreakingException on the heaviest distinct-aggregation
queries. Those failures are real CrateDB behavior (a subset of the failures
upstream ClickBench also records for it), and ClickBench penalizes a missing
result heavily, which is what drags the geometric mean up to ~17. We are leaving
it in and reporting it honestly across all three passes.
Tweak one: more iterations
This brings us to ClickBench issue #934, "Methodology: 3 hot iterations is insufficient for JVM-based engines." The argument: a JIT compiler keeps optimizing code as it runs, so three iterations can catch a JVM engine mid-warmup and report times slower than its true steady state.
You might argue against changing this. But it is very unlikely that you run a query exactly three times and then restart your server. Traditional databases have uptimes of weeks, if not months. A JIT may not have produced its most optimized code after only three executions, so raising the iteration count compares every engine in its fully warmed-up condition. We bumped the hot iterations to 10 for all four engines and re-measured.
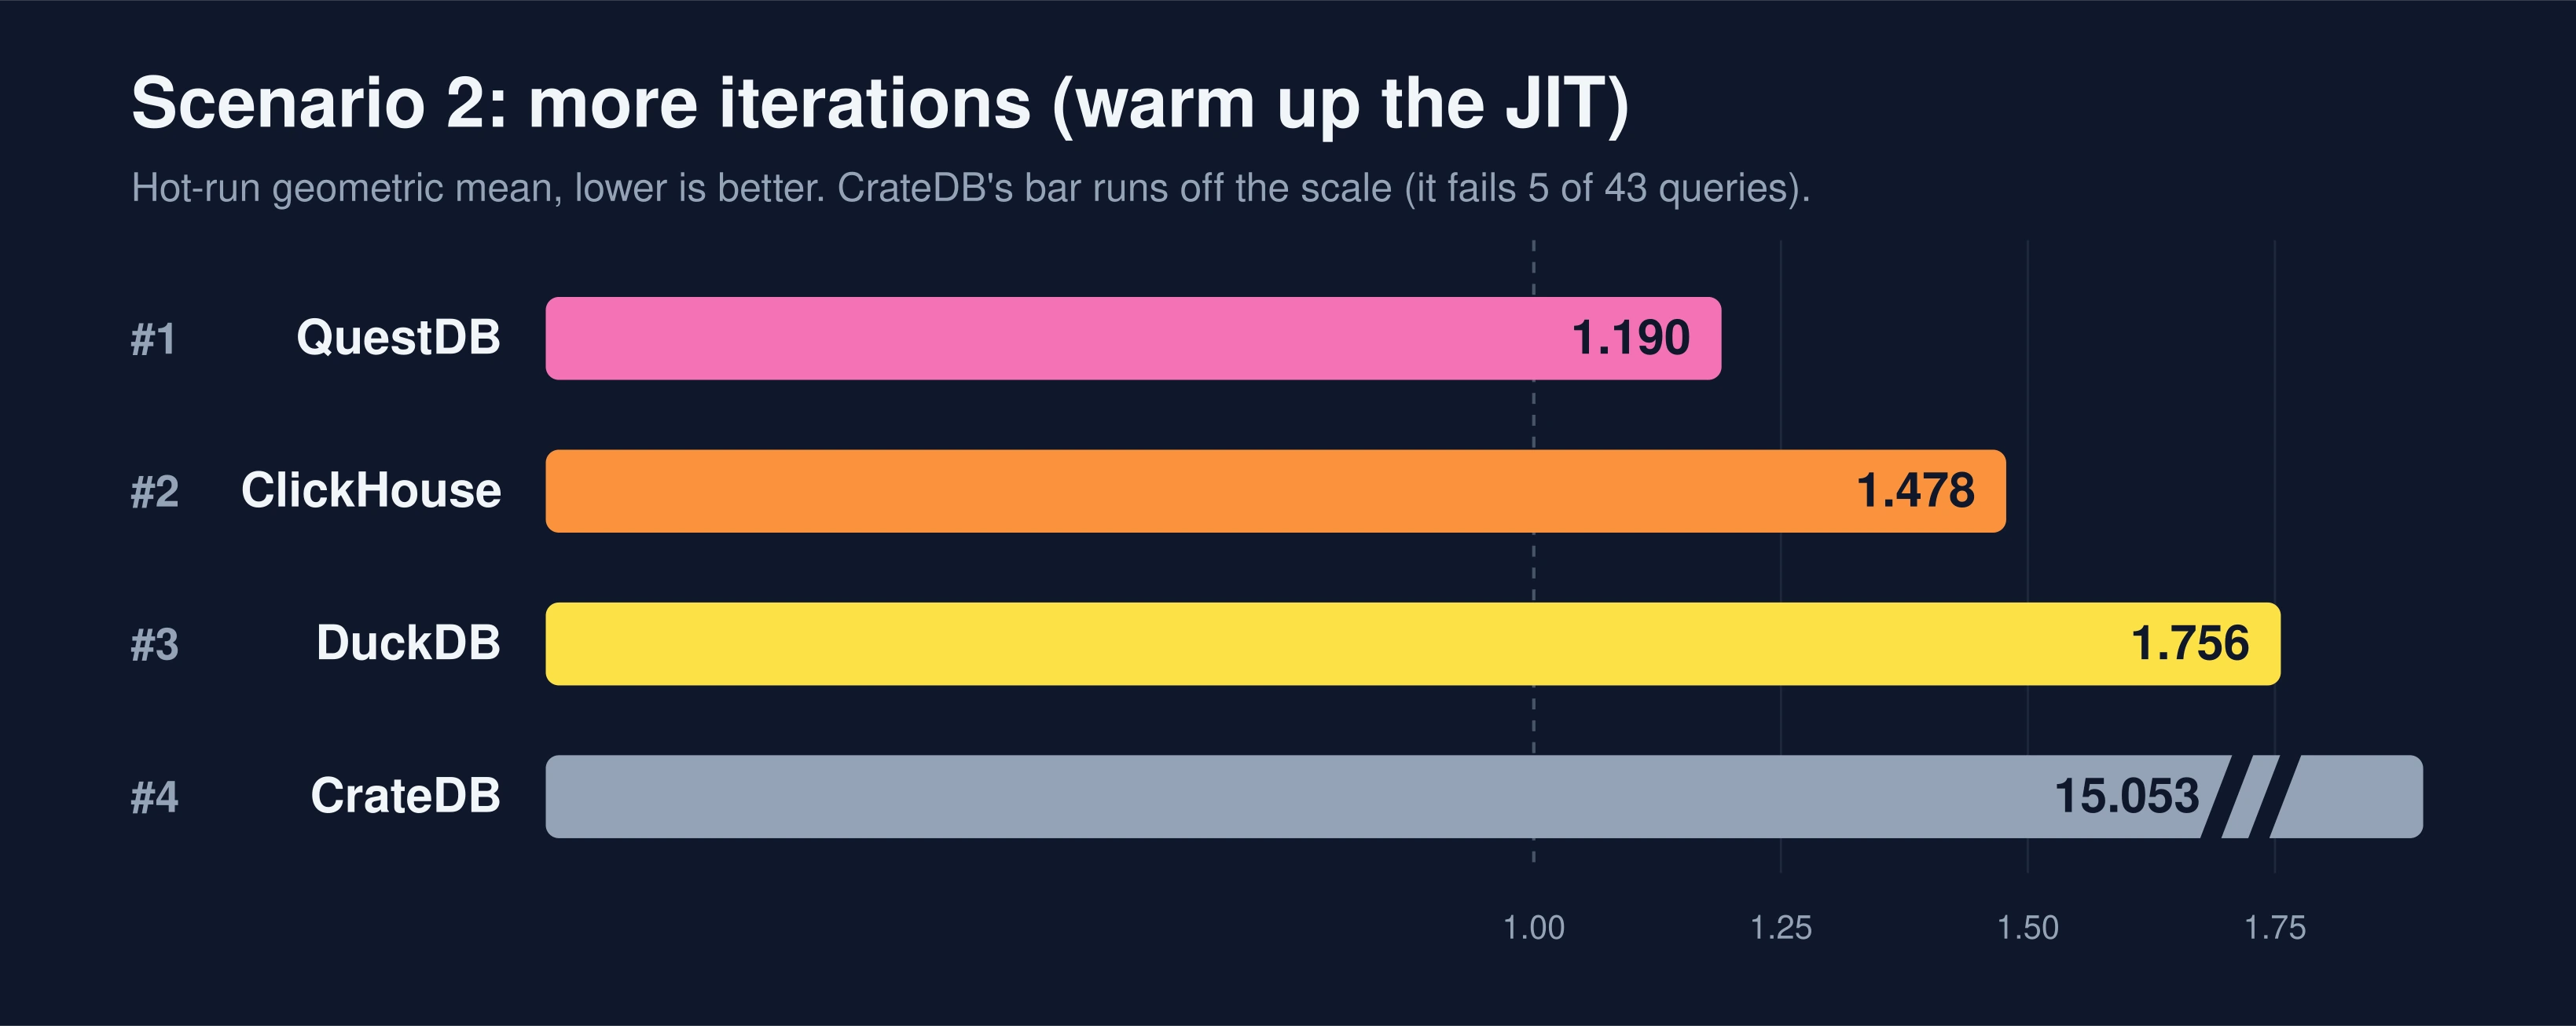
No re-ranking this time, but the numbers tell the story. The JVM engines warmed up and got faster: QuestDB 1.13x, CrateDB 1.27x (its off-scale score even drops from 17.482 to 15.053, though it still fails the same five queries). The AOT-compiled ClickHouse was essentially flat at 1.07x, exactly as you would expect from code that was already fully compiled before the first query. DuckDB could not warm up at all (it still spawns a fresh process per query in this pass), so its score did not improve.
QuestDB was already first, so warmup just padded its lead. But the close-race implication is the real point: had a rival been only narrowly ahead in the vanilla run, this same ~13% JVM warmup would have been enough to de-crown it. Warmup is a re-ranking lever for close races. It just leaves a clear leader in place, which is why it changed nothing here.
A fair disclosure: QuestDB runs on the JVM, so this change flatters us, and issue #934 happens to be one we opened ourselves. Normally that is a red flag: a vendor pushing for a benchmark change that happens to help it. Treat ours with the same suspicion you would anyone else's. Two things keep us comfortable making the case anyway. First, it is not a QuestDB special case: every JVM engine gains, CrateDB among them, as its score climbing in this same pass shows. Second, the other lever in this post, keeping a process alive, helps DuckDB and not us, and we are all for switching that on too. The argument is for changes that make the benchmark more realistic, not for ones that only lift our own bar.
Tweak two: keep DuckDB alive too
Now let's stack the Scenario 1 trick on top: in addition to the extra iterations, we keep DuckDB's process resident, so its native storage stays warm in the buffer pool between runs.
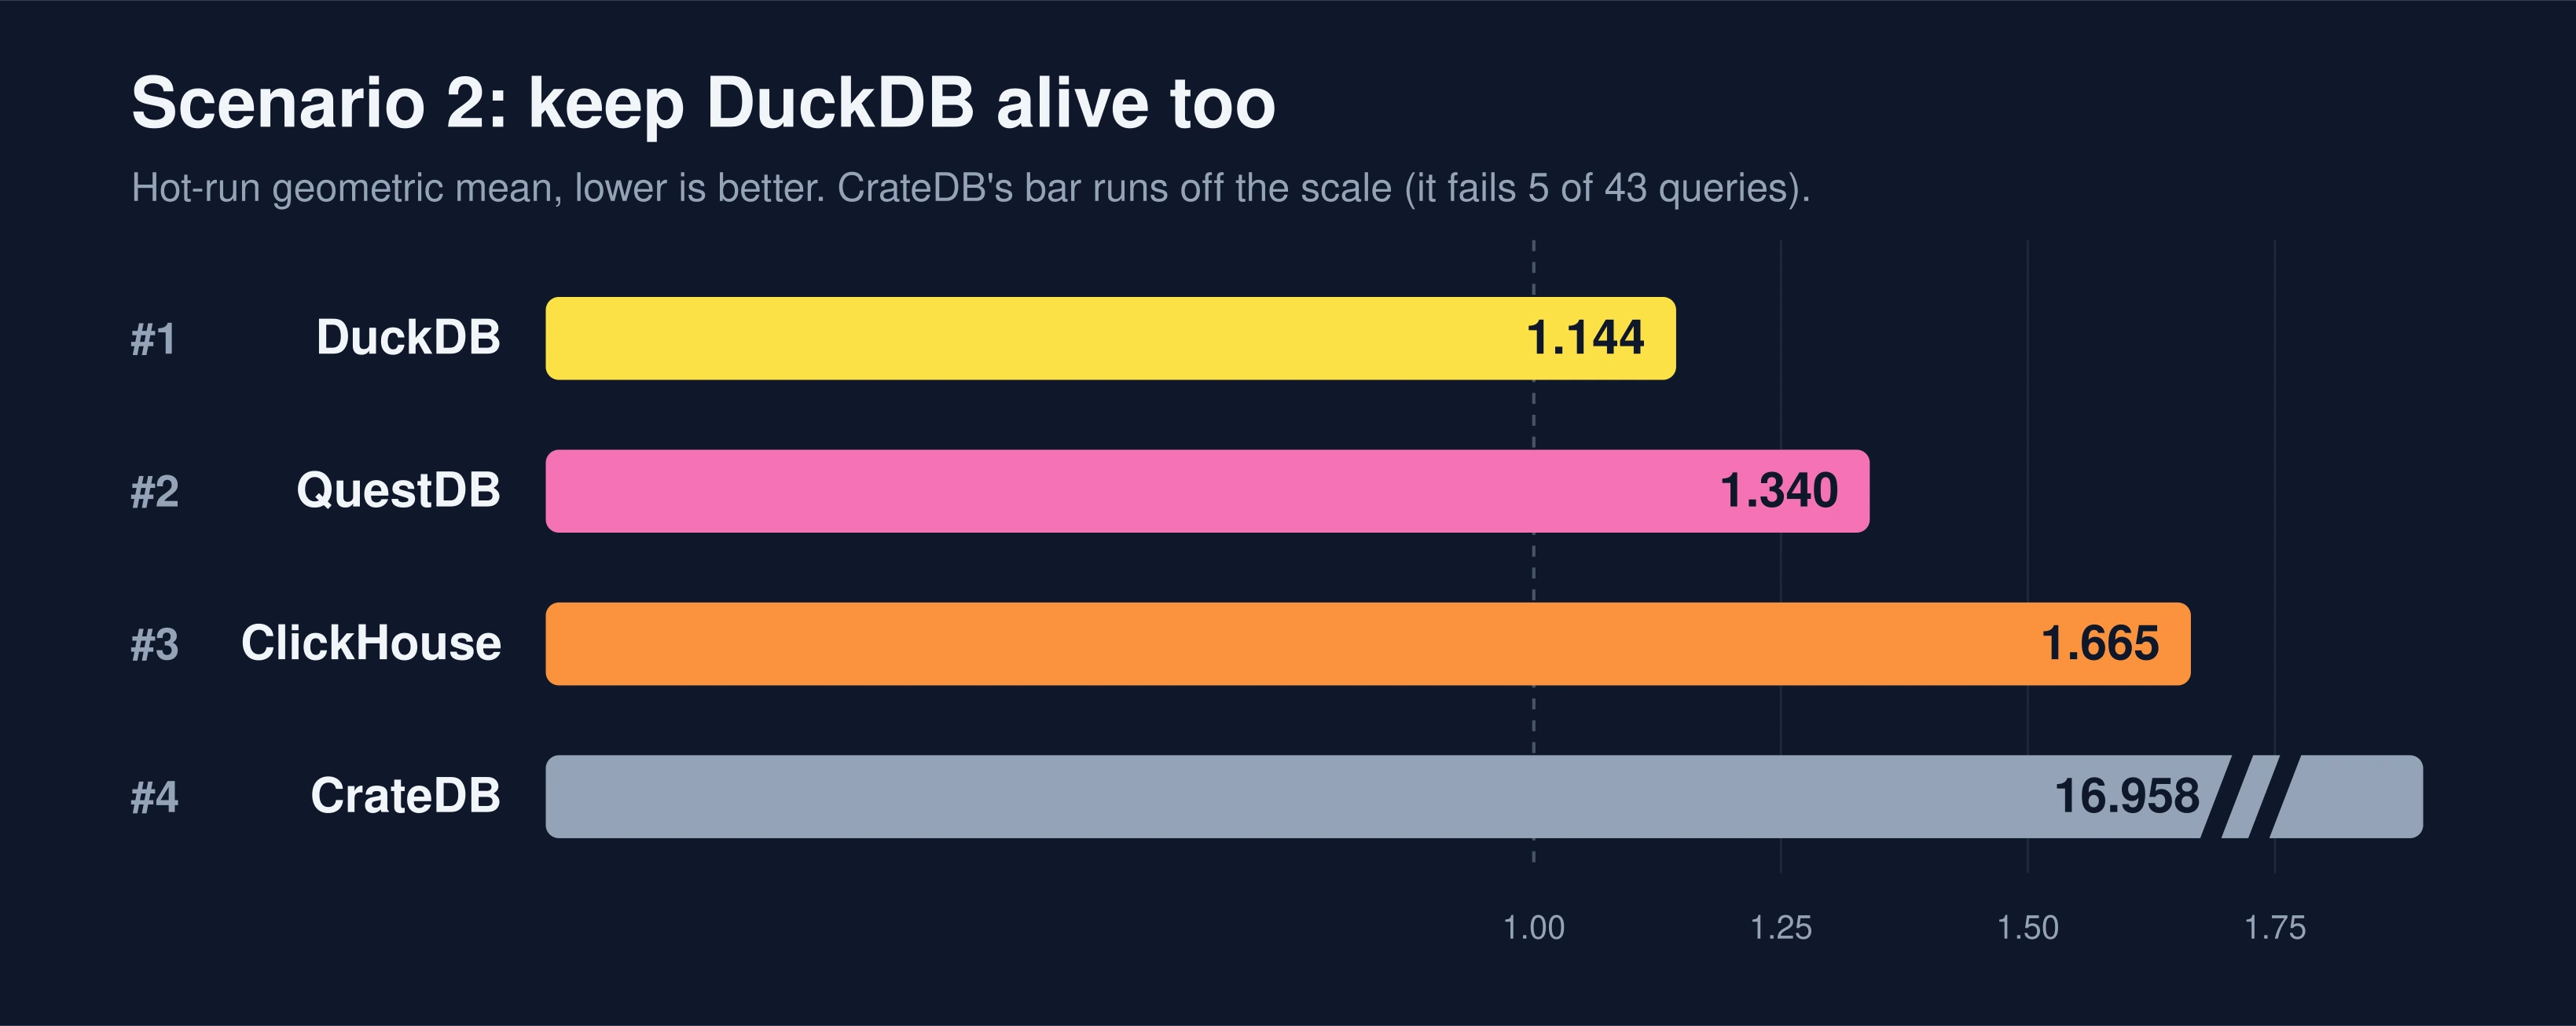
There it is. Keeping DuckDB resident makes it 1.69x faster (native buffer-pool warmth pays off even more than the Parquet metadata cache did in Scenario 1), and that vaults it from third to first, ahead of QuestDB. Same machine, same queries, same data. One fair-but-different knob.
And notice QuestDB's score: it rose from 1.190 to 1.340. QuestDB did not slow down. Its 10-iteration times are identical to the previous chart. This is the Polars effect from Scenario 1 all over again: the per-query baseline got faster once DuckDB sped up, so every other system's ratio drifted upward without any of them changing a thing (CrateDB climbed right back from 15.053 to 16.958 for the exact same reason). If you only glanced at QuestDB's number across the two charts, you might conclude it regressed. It did not: only the baseline beneath it moved.
Are we doomed?
Does this post claim that all database benchmarks are useless? Not really. But it does claim that none of them should be fully trusted. ClickBench says as much itself, right in its own rules: take the results "with a grain of salt."
A tiny nuance hidden in benchmark source code can change the final ranking dramatically. We did not cheat in any of the scenarios above. We did not touch a single query, a single timing method, or a single line of data. We changed whether a process stays alive, and how many times a query runs. Both are defensible, arguably more realistic than the defaults, and both reshuffled the leaderboard.
So when you see the next "we beat every competitor in benchmark X" article, do not rush to judgment. Look at the exact scenario and ask whether it resembles how your application actually talks to a database. If it does not, and you are choosing an engine, you are far better off with your own measurements based on your own workload. That is hard to get right, but it is the only result that is truly about you. If that is too much, at least look at more than one benchmark rather than a single number. And yes, this applies to our benchmarks too. We publish our own, and we would tell you the same thing about them: read them closely.
Does any of this mean that we, the QuestDB team, will stop participating in benchmarks? No way. If anything, we want to participate in more of them. Benchmarks are one of the best ways we have to find the weak spots in the database and improve it. Every workload that exposes a query pattern where we are slower than we should be is, in effect, a free bug report and a line on the roadmap. ClickBench itself has done that for us more than once. So we will keep showing up, keep publishing numbers, and keep asking you to read all of them, ours included, with a critical eye. To borrow the analogy from the top of this post: we want to run faster, even if that means learning to whistle "Yellow Submarine" well.
As for ClickBench, we find it valuable and do not want to criticize it too much. Maintaining a public benchmark at this scale is very hard, and the ClickHouse team does a great job of it. Over the years they have addressed many issues that we and other community members raised. The two issues that seeded this post, #934 on JVM iteration counts and #936 on Hyper measuring cold times, are both open and acknowledged, and the QuestDB version bug we tripped over became PR #902. The team is aware, and the benchmark keeps improving.
Everything here is fully reproducible. The harness, the overlays, and every result file are in the clickbench-experiments repository. Clone it, run it on your own machine, and see what your hardware does to the rankings. We publish our measured numbers under ClickBench's own usage rules, which invite exactly that. And the ranking you produce yourself is the only one we would tell you to trust.