QuestDB MCP Server
The official QuestDB MCP server (@questdb/mcp-server-questdb) connects coding agents to a running Web Console. The agent gets tools to explore your database schema, run SQL, and build notebooks with charts and live dashboards. Every action executes in the browser through your already-authenticated console session: the server runs locally on your machine, listens on loopback only, and never handles credentials.
The setup wizard detects and configures Claude Code, Codex, Cursor, OpenCode, and Gemini CLI. Any other MCP client works with the manual configuration.
No coding agent? The built-in AI Assistant has the same capabilities: it builds notebooks and dashboards from a prompt right inside the console, using your own API keys or a local model.
Do you need an MCP server to query QuestDB?
Not for plain data access. QuestDB speaks HTTP natively, so any coding agent can use the REST API out of the box, with no MCP server in between. What the MCP server adds is the Web Console: the agent builds notebooks, charts, and live dashboards in the browser tab you are looking at, through your existing session. A direct HTTP connection cannot do that. This also gives you SSO support: on QuestDB Enterprise, the agent works through your SSO-authenticated console session, with no credentials of its own.
Setup
One command configures the MCP server for every supported agent on your machine; the only prerequisite is Node.js, which provides npx. Each Web Console version expects a specific server version: click the MCP status pill at the bottom of the Web Console to see the setup command for your console, already pinned to the expected version.
- Setup wizard (recommended)
- Manual configuration
Copy the setup command from the MCP status pill and run it in your terminal:
npx @questdb/mcp-server-questdb@<expected-version> setup
The wizard detects your installed coding agents, lets you pick which ones to configure, and writes the server into each agent's MCP config, pinned to that version.
Add the server to your MCP client's config file by hand, pinning the version shown in the MCP status pill. For Claude Code that file is .mcp.json in the project root; other clients name their own location:
{
  "mcpServers": {
    "questdb": {
      "command": "npx",
      "args": ["-y", "@questdb/mcp-server-questdb@<expected-version>"]
    }
  }
}
The server reads these environment variables:
| Variable | Default | Description |
|---|---|---|
CONSOLE_ORIGIN | http://127.0.0.1:9000 | Web Console origin to pair with. |
MCP_BRIDGE_PORT | auto-allocated | Fixed WebSocket port for the server. |
LOG_PATH | /tmp/questdb-mcp-bridge/… | Log file location. |
LOG_LEVEL | INFO | DEBUG adds heartbeats and full tool payloads. |
Pairing
Before any tool works, your browser has to pair with the MCP server. The agent drives the flow, and you do not need the Web Console open beforehand: when the agent needs to pair, the server opens a pairing link in your default browser, and the Web Console shows a consent prompt where you review the connection, pick a permission level, and connect.
If the automatic open does not reach the right browser, the agent also shows the pairing credentials so you can pair yourself:
- Click the deep link it surfaces to open the pairing prompt in your browser.
- Or paste the WebSocket URL and token into the MCP status pill at the bottom of the console.
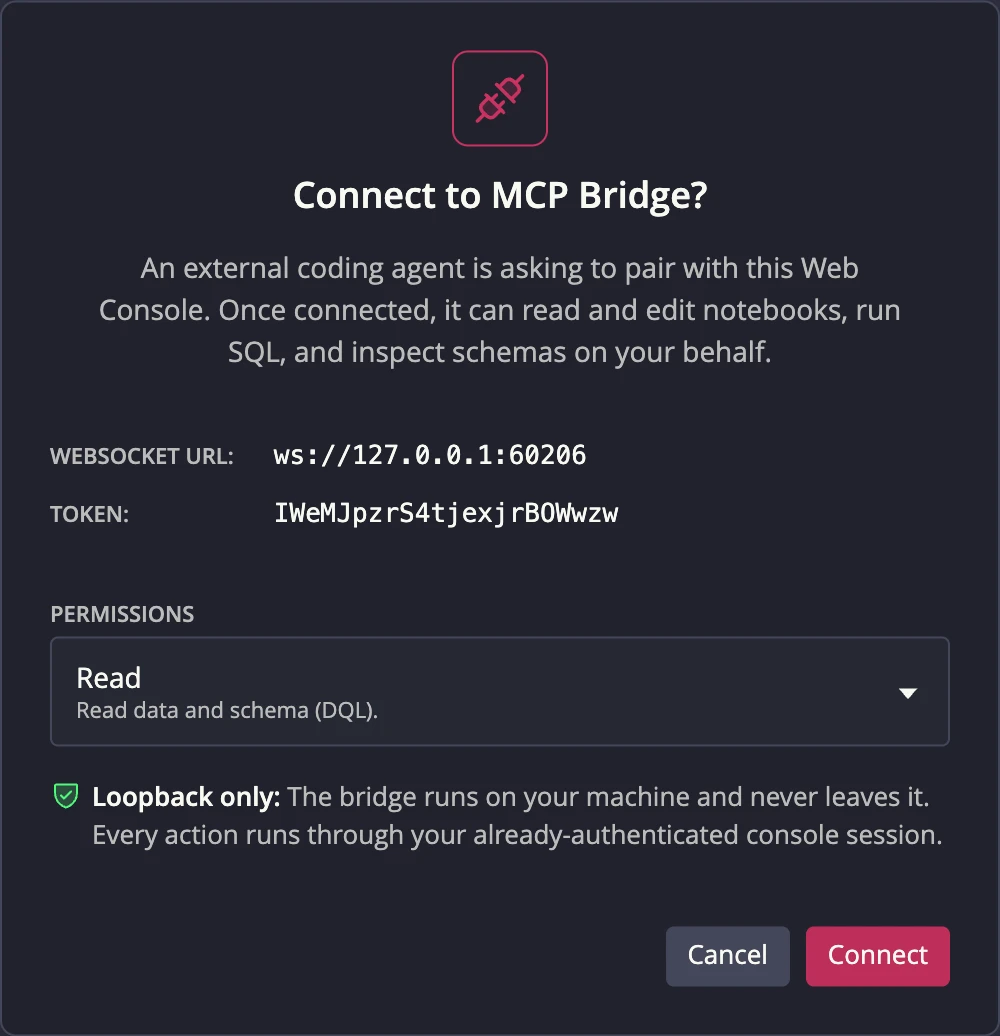
Each server run generates a fresh pairing token, held only in memory. By
default, the server also auto-allocates a port; when MCP_BRIDGE_PORT is set,
it uses that fixed port instead. If the console and server versions do not
match, the consent prompt tells you which server version to run.
Permission levels
You choose what the agent is allowed to see and do when you accept the pairing, and you can change it at any time from the MCP status pill in the footer.
| Level | What the agent gets |
|---|---|
| None | Notebook, query-validation, and documentation tools. Direct database schema tools and query-result rows are unavailable; existing notebook SQL and markdown remain visible to the agent. |
| Schema access | The table list, column definitions, and table statistics. |
| Read | Schema access, plus ad-hoc DQL queries that return result rows to the agent. |
| Write | Read, plus DDL and DML execution (CREATE, INSERT, UPDATE, DROP). |
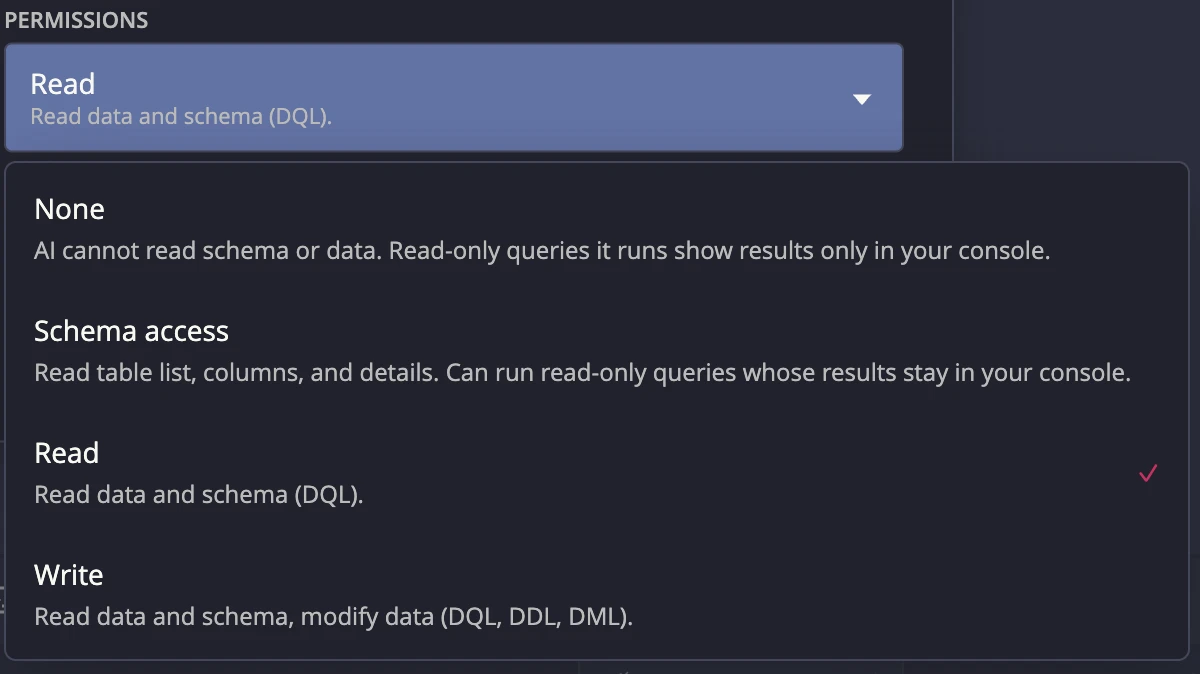
Permissions are enforced by the Web Console, not by the MCP server or the agent. The console classifies every SQL statement before execution and does not let DDL/DML run unless the Write permission is given.
At every level, the agent can still run read-only cells inside a notebook. The results render in your console, but the rows are never returned to the agent.
What agents can do
Once paired, the agent has tools covering several areas:
- Schema exploration: list tables and materialized views, fetch DDL, and read runtime table statistics.
- SQL execution: run ad-hoc queries with results returned to the agent (100 rows by default, up to 10,000, capped at about 1 MB per response), and validate query syntax without executing.
- Documentation lookup: built-in reference for QuestDB functions, operators, and SQL keywords, so generated SQL uses correct QuestDB syntax without web searches.
- Notebooks: create, duplicate, and archive notebooks; add, edit, move, and run SQL and markdown cells; switch cells to chart mode with nine chart types (line, area, step line, step area, bar, stacked bar, scatter, pie, candlestick); arrange cells into a grid dashboard; and set per-cell or notebook-wide chart auto-refresh.
- Two-way handoff: hand analysis back and forth with the agent; it snapshots the workspace and fetches a digest of your recent edits, so you can both work on the same notebook without conflicts.
Background edits
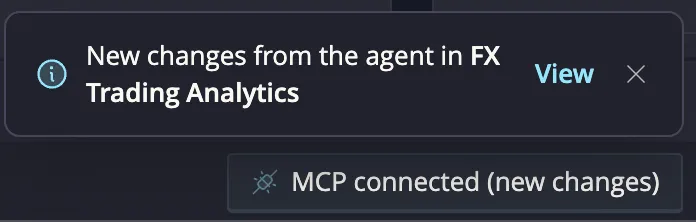
The agent builds and edits notebooks without taking over the console. New notebooks are created as background tabs, and when an agent changes a notebook you are not looking at, the console shows a "New changes from the agent" notification with a View action that jumps to the change, while the MCP status pill signals the pending changes.
Example: An FX dashboard from one prompt
With the MCP server configured and QuestDB running, a single prompt is enough for a full technical-analysis dashboard:
Build an FX technical-analysis dashboard for FX symbols ('GBPUSD' by default) for the last 12 hours in my QuestDB Web Console.

Use the fx_trades and market_data tables, along with the related
materialized views.

The charts I'd like to have in the dashboard:

1. Price (OHLC @interval) & Volume: Full-width candlestick and volume chart.
Add the necessary min/max values to the axes so that volume occupies only the bottom ~20% of the chart.
2. Trend: SMA20 vs SMA50: Line chart showing the 20-bar and 50-bar moving averages of the close price, ordered properly.
3. Bollinger Bands (20, 2σ): Line chart showing close, mid (SMA20), upper, and lower bands.
4. VWAP vs Close
5. Volume by Side: Stacked bar chart showing volumes categorized by side.
6. RSI (14)
7. MACD (12, 26, 9)
8. ATR (14, bps)

The dashboard should auto-refresh every second.
The agent pairs with the console, loads its QuestDB SQL guidance, validates each indicator query, and builds the whole dashboard in a background tab. You approve the connection once, then click the notification when it is ready:
Next steps
- The MCP server is open source at github.com/questdb/mcp-server-questdb and published on npm as @questdb/mcp-server-questdb: issues and contributions welcome
- AI coding agents covers agent skills and REST API access
- Live dashboards shows how to build the same dashboards by hand
- Web Console overview tours the console surfaces