How a Kernel Bug Froze My Machine: Debugging an Async-profiler Deadlock
I've been a Linux user since the late 90s, starting with Slackware on an underpowered AMD K6. Over the years I've hit plenty of bugs, but the last decade has been remarkably stable - until a kernel bug started freezing my machine whenever I used async-profiler.
I'm not a kernel developer, but I found myself poking around kernel source code to understand the problem better and figure out what was going on under the hood.
The problem
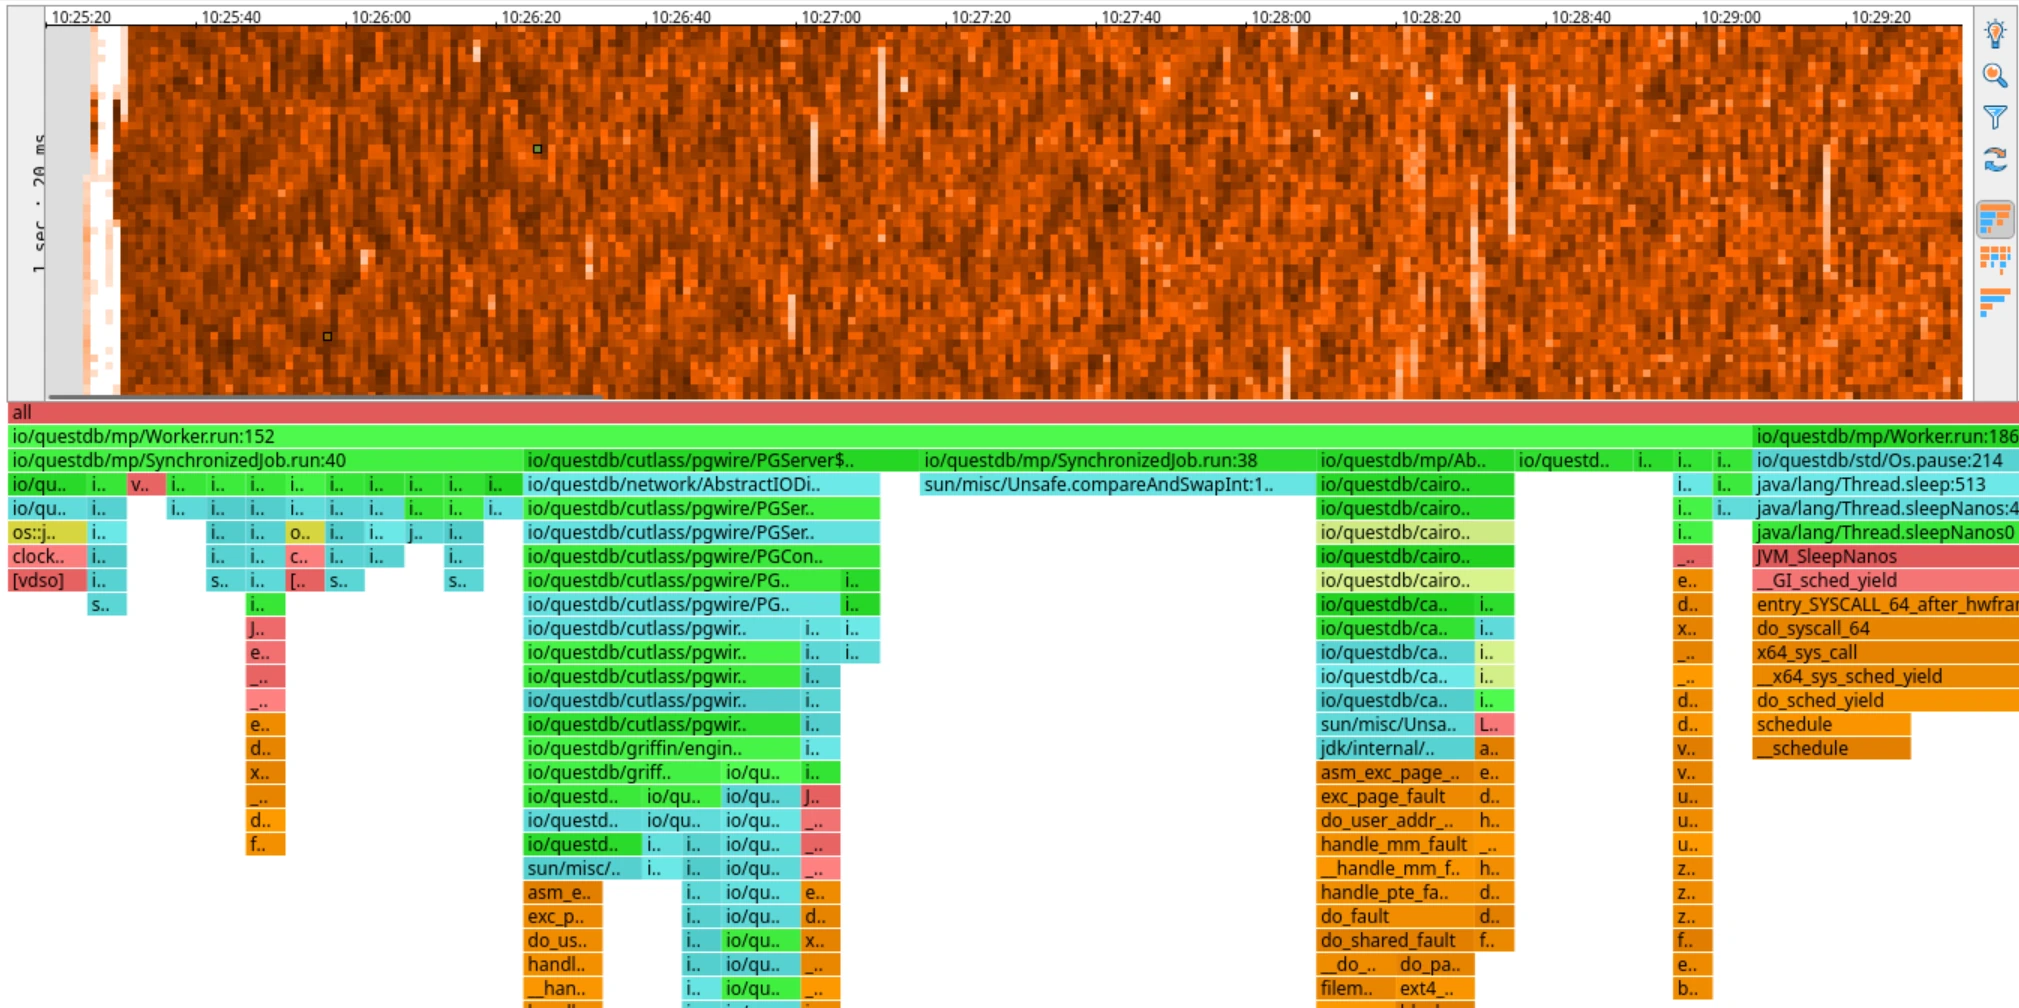
I was about to start an investigation of latency spikes in QuestDB reported by a user. To do that, I wanted to use the async-profiler to capture CPU heatmaps.
However, when I tried to attach the profiler, my machine froze completely. It did not respond to any keys, it was impossible to switch to a terminal, it did not respond to SSH. The only way to recover was to hard reboot it. I tried to start QuestDB with the profiler already configured to start at launch - the same result, a frozen machine almost immediately after the launch.
I thought that was weird, this had not happened to me in years. It was already late in the evening, I felt tired anyway so I decided to call it a day. There was a tiny chance I was hallucinating and the problem would go away by itself overnight. A drowning man will clutch at a straw after all.
The next day, I tried to attach the profiler again - same result, frozen machine. Async-profiler integration in QuestDB is a relatively new feature, so I thought there might be a bug in the integration code, perhaps a regression in the recent QuestDB release. So I built an older QuestDB version: The same result, frozen machine. This was puzzling - I positively knew this worked before. How do I know? Because I worked on the integration code not too long ago, and I tested the hell out of it.
This was a strong hint that the problem was not in QuestDB, but rather in the environment. I've gotten lazy since my Slackware days and I have been using Ubuntu for years now and I realized that I had recently updated Ubuntu to the latest version: 25.10. Could it be that the problem is in the new Ubuntu version?
At this point I started Googling around and I found a report created by a fellow performance aficionado, Francesco Nigro, describing exactly the same problem: machine freeze when using async-profiler. This was the final confirmation I was not hallucinating! Except Francesco is using Fedora, not Ubuntu. However, his Fedora uses the same kernel version as my Ubuntu: 6.17. I booted a machine with an older Ubuntu, started QuestDB and attached the profiler and it worked like a charm. This was yet another indication that the problem was in the system, possibly even in the kernel. This allowed me to narrow down my Google keywords and find this kernel patch which talks about the very same problem!
I found it quite interesting: A kernel bug triggered by async-profiler causing machine freezes on recent mainstream distributions. After some poking I found a workaround:
Start the profiler with -e ctimer option to avoid using the problematic kernel feature. I tried the workaround and indeed, with this option, the profiler worked fine and my machine did not freeze.
Normally I'd move on, but I was curious. What exactly is going on under the hood? Why is it freezing? What is this
ctimer thing? What exactly is the bug and how does the patch work? So I decided to dig deeper.
How Async-profiler Works
Async-profiler is a sampling profiler. It periodically interrupts threads in the profiled application and collects their stack traces. The collected stack traces are then aggregated and visualized in
various ways (flame graphs are one of the most popular visualizations). It has multiple ways to interrupt the profiled application, the most common one is using perf_events kernel feature. This is how it works by default on Linux
assuming kernel paranoia settings allow it.
perf_events Under the Hood
The perf_events subsystem is a powerful Linux kernel feature for performance monitoring. For CPU profiling, async-profiler uses
a software event called cpu-clock, which is driven by high-resolution timers (hrtimers) in the kernel.
Here's the sequence of events during profiling:
- Setup: For each thread in the profiled application, async-profiler opens a
perf_eventfile descriptor configured to generate a signal after a specified interval of CPU time (e.g., 10ms). - Arming the event: The profiler calls
ioctl(fd, PERF_EVENT_IOC_REFRESH, 1)to arm the event for exactly one sample. This is a one-shot mechanism, combined with theRESETat the end of the handler. The goal is to measure application CPU time only and exclude the signal's handler own overhead. - Timer fires: When the configured CPU time elapses, the kernel's hrtimer fires and delivers a signal to the target thread.
- Signal handler: Async-profiler's signal handler captures the stack trace and records the sample. At the end of the handler, it resets the counter and re-arms the event for the next sample:
ioctl(fd, PERF_EVENT_IOC_RESET, 0); // Clear the counterioctl(fd, PERF_EVENT_IOC_REFRESH, 1); // Arm for exactly 1 more sample
This cycle repeats for the duration of the profiling session, creating a stream of stack trace samples that are later aggregated into flame graphs or heatmaps.
The Kernel Bug
The kernel bug that caused my machine to freeze was introduced by commit 18dbcbfabfff ("perf: Fix the POLL_HUP delivery breakage"). Ironically, this commit was fixing a different bug, but it introduced a deadlock in the cpu-clock event handling.
Here's what happens in the buggy kernel when the PERF_EVENT_IOC_REFRESH(1) counter reaches zero:
- hrtimer fires for cpu-clock event -
perf_swevent_hrtimer()is called (inside hrtimer interrupt context) perf_swevent_hrtimer()calls__perf_event_overflow()- this processes the counter overflow__perf_event_overflow()decides to stop the event (counter reached 0 afterPERF_EVENT_IOC_REFRESH(1)) - callscpu_clock_event_stop()cpu_clock_event_stop()callsperf_swevent_cancel_hrtimer()- this callshrtimer_cancel()to cancel the timer- DEADLOCK:
hrtimer_cancel()waits for the hrtimer callback to complete - but we ARE inside the hrtimer callback! The system hangs forever waiting for itself
The function hrtimer_cancel() is a blocking call - it spins waiting for any active callback to finish.
int hrtimer_cancel(struct hrtimer *timer){int ret;do {ret = hrtimer_try_to_cancel(timer);if (ret < 0)hrtimer_cancel_wait_running(timer);} while (ret < 0);return ret;}
When called from inside that same callback, it waits forever. Since this happens in interrupt context with interrupts disabled on the CPU,
that CPU becomes completely unresponsive. When this happens on multiple CPUs (which it does, since each thread has its own
perf_event), the entire system freezes.
Click to see the deadlock visualized
The Fix
The kernel patch fixes this deadlock with two changes:
- Replace
hrtimer_cancel()withhrtimer_try_to_cancel()
- hrtimer_cancel(&hwc->hrtimer);+ hrtimer_try_to_cancel(&hwc->hrtimer);
hrtimer_try_to_cancel() is non-blocking - it returns immediately with:
0if the timer was not active1if the timer was successfully cancelled-1if the timer callback is currently running
Unlike hrtimer_cancel(), it doesn't spin waiting for the callback to finish. So when called from within the callback itself, it simply returns -1 and continues.
- Use
PERF_HES_STOPPEDflag as a deferred stop signal
The stop function now sets a flag:
static void cpu_clock_event_stop(struct perf_event *event, int flags){+ event->hw.state = PERF_HES_STOPPED;perf_swevent_cancel_hrtimer(event);...}
And the hrtimer callback checks this flag:
static enum hrtimer_restart perf_swevent_hrtimer(struct hrtimer *hrtimer){- if (event->state != PERF_EVENT_STATE_ACTIVE)+ if (event->state != PERF_EVENT_STATE_ACTIVE ||+ event->hw.state & PERF_HES_STOPPED)return HRTIMER_NORESTART;
How It Works Together
When cpu_clock_event_stop() is called from within the hrtimer callback:
PERF_HES_STOPPEDflag is sethrtimer_try_to_cancel()returns-1(callback running) - but doesn't block- Execution returns up the call stack back to
perf_swevent_hrtimer() perf_swevent_hrtimer()completes and returnsHRTIMER_NORESTART(because__perf_event_overflow()returned1, indicating the event should stop)- The hrtimer subsystem sees
HRTIMER_NORESTARTand doesn't reschedule the timer
When cpu_clock_event_stop() is called from outside the callback (normal case):
PERF_HES_STOPPEDflag is sethrtimer_try_to_cancel()returns0or1- timer is cancelled immediately- If by chance the callback fires before cancellation completes, it sees
PERF_HES_STOPPEDand returnsHRTIMER_NORESTART
The PERF_HES_STOPPED flag acts as a safety net to make sure the timer stops regardless of the race between setting the flag and the timer firing.
Debugging a kernel
The explanation above is my understanding of the kernel bug and the fix based on reading the kernel source code. I am a hacker, I like to tinker. A theoretical understanding is one thing, but I wanted to see it in action. But how do you even debug a kernel? I'm not a kernel developer, but I decided to try. Here is how I did it.
My intuition was to use QEMU since it allows one to emulate or virtualize a full machine. QEMU also has a built-in GDB server that allows you to connect GDB to the emulated machine.
Setting up QEMU with Ubuntu
I downloaded an Ubuntu 25.10 ISO image and created a new empty VM disk image:
$ qemu-img create -f qcow2 ubuntu-25.10.qcow2 20G
Then I launched QEMU to install Ubuntu:
$ qemu-system-x86_64 \-enable-kvm \-m 4096 \-smp 4 \-drive file=ubuntu-25.10.qcow2,if=virtio \-cdrom ubuntu-25.10-desktop-amd64.iso \-boot d \-vga qxl
The second command boots the VM from the ISO image and allows me to install Ubuntu on the VM disk image. I went through the installation process as usual. I probably could have used a server edition or a prebuilt image, but at this point I was already in unknown territory, so I wanted to make other things as simple as possible.
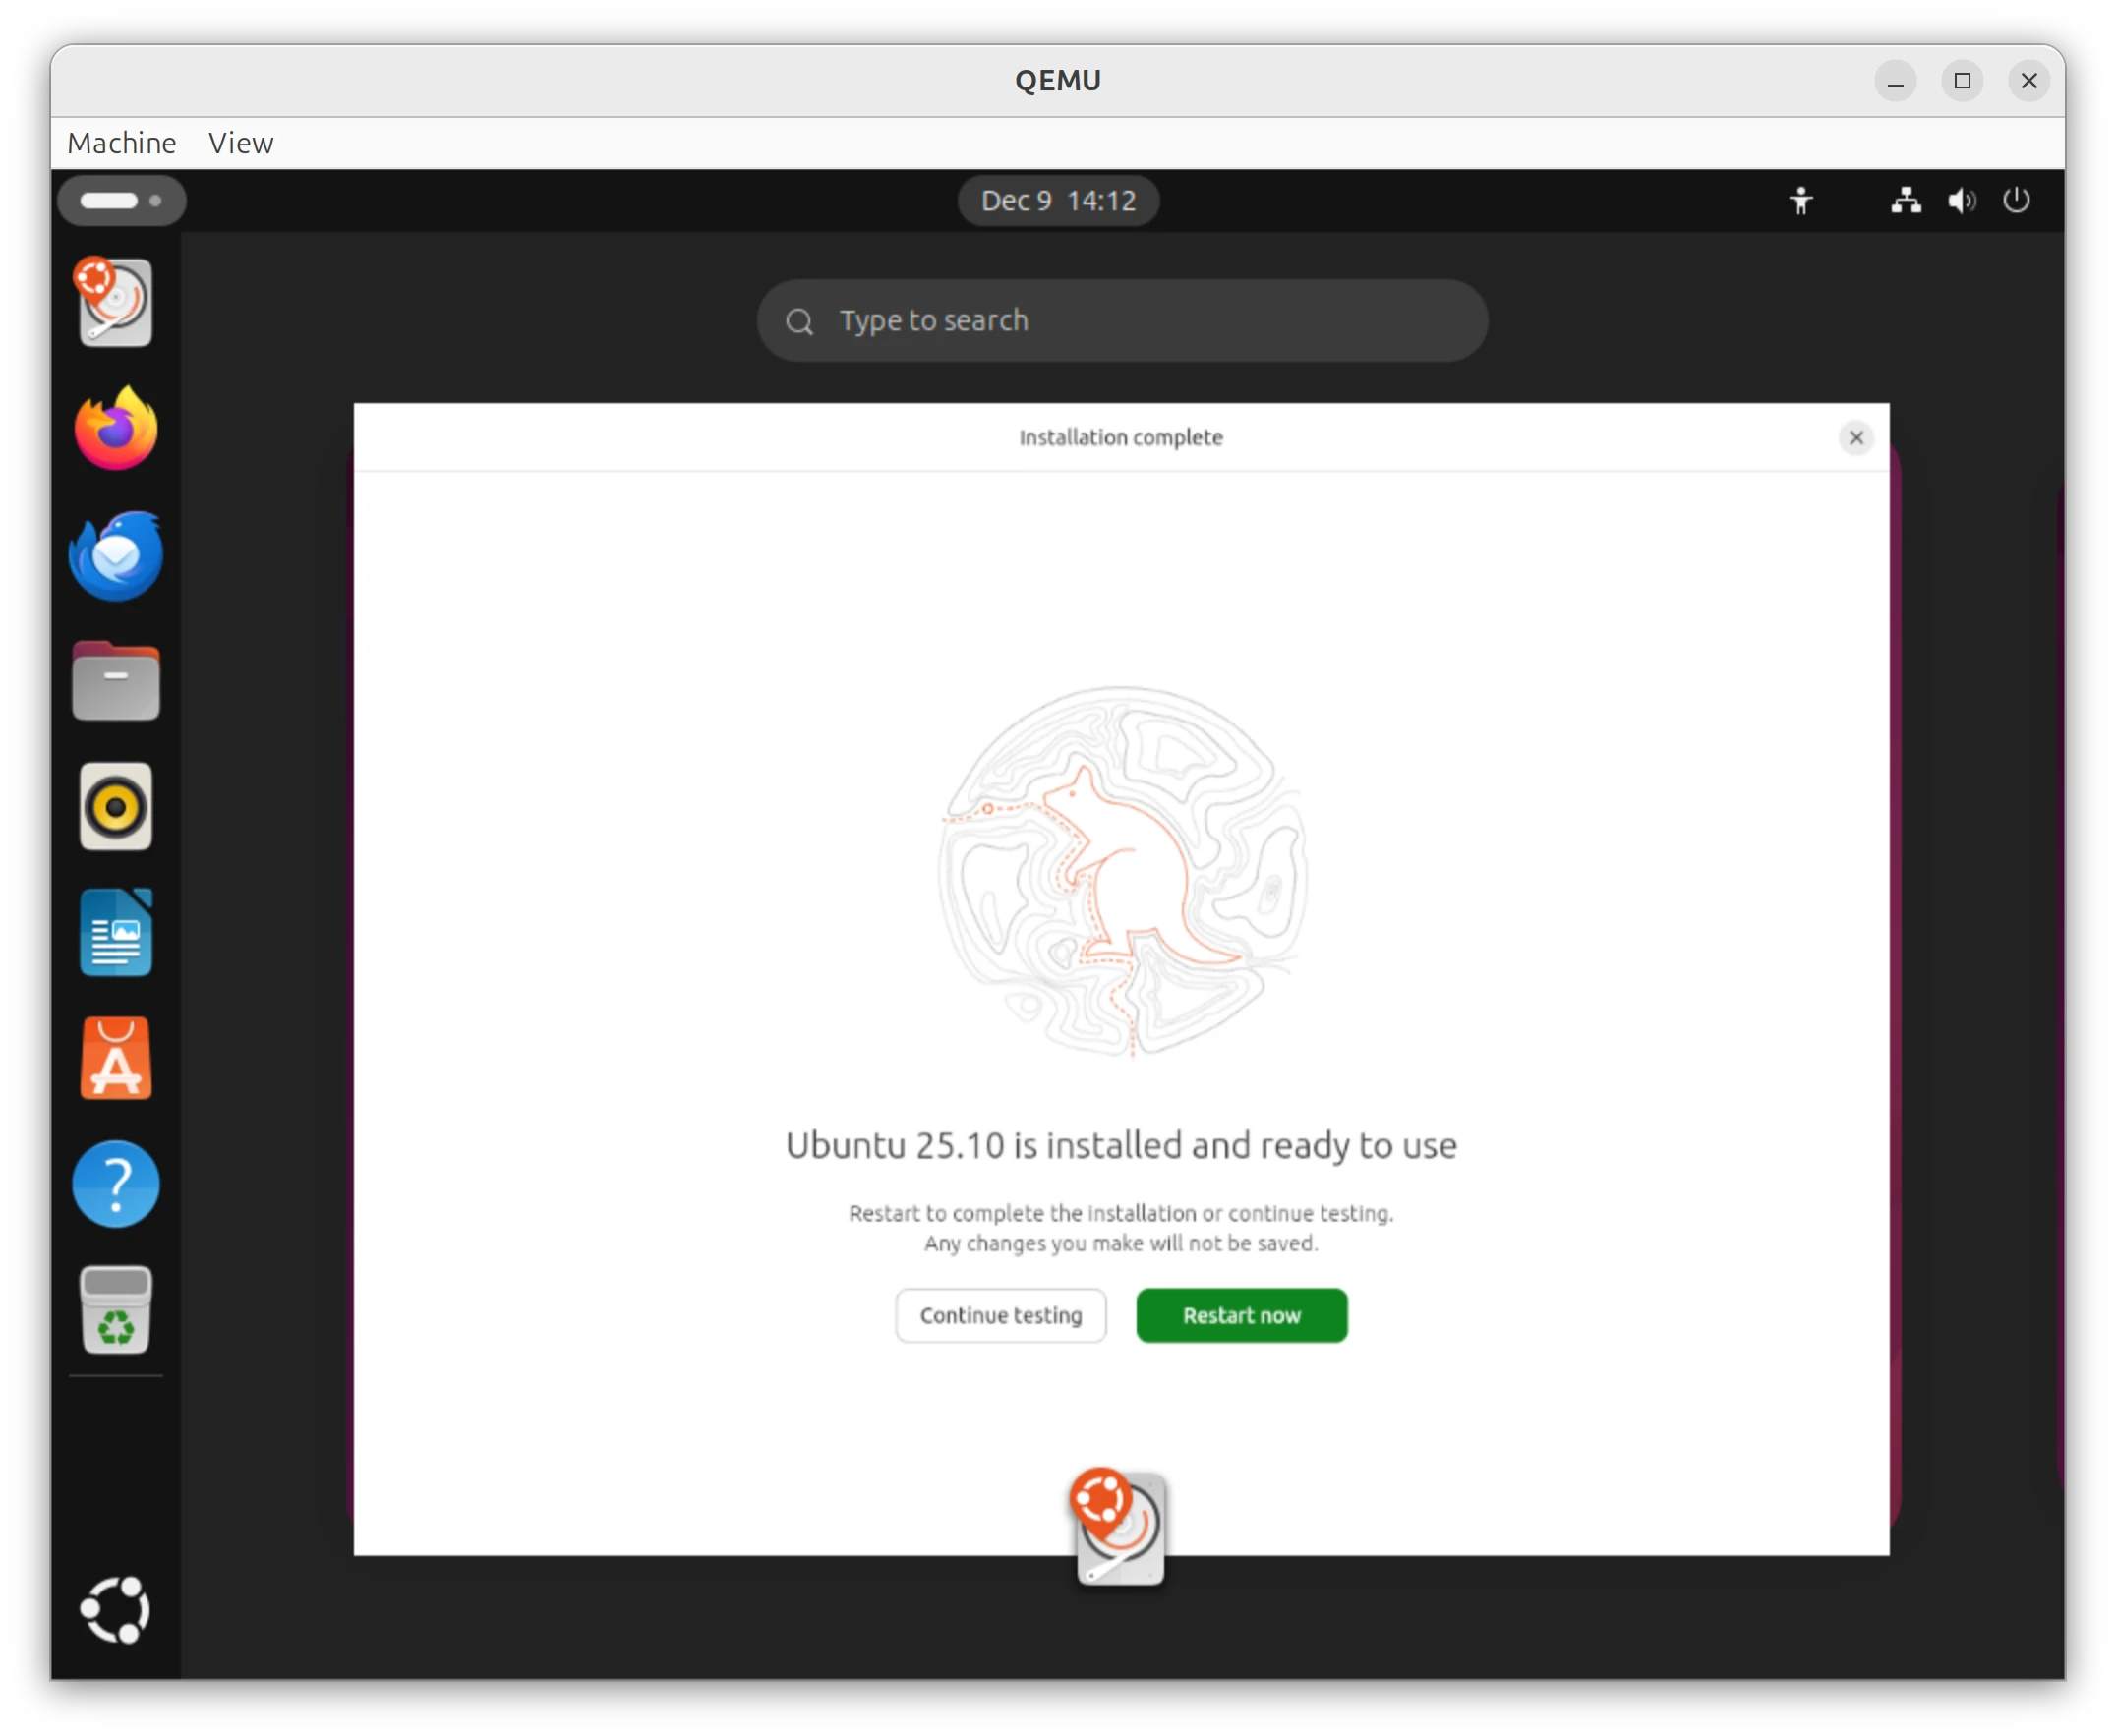
Once the installation was complete, I rebooted the VM:
$ qemu-system-x86_64 \-enable-kvm \-m 4096 \-smp 4 \-drive file=ubuntu-25.10.qcow2,if=virtio \-netdev user,id=net0,hostfwd=tcp::9000-:9000 \-device virtio-net-pci,netdev=net0 \-monitor tcp:127.0.0.1:55555,server,nowait \-s
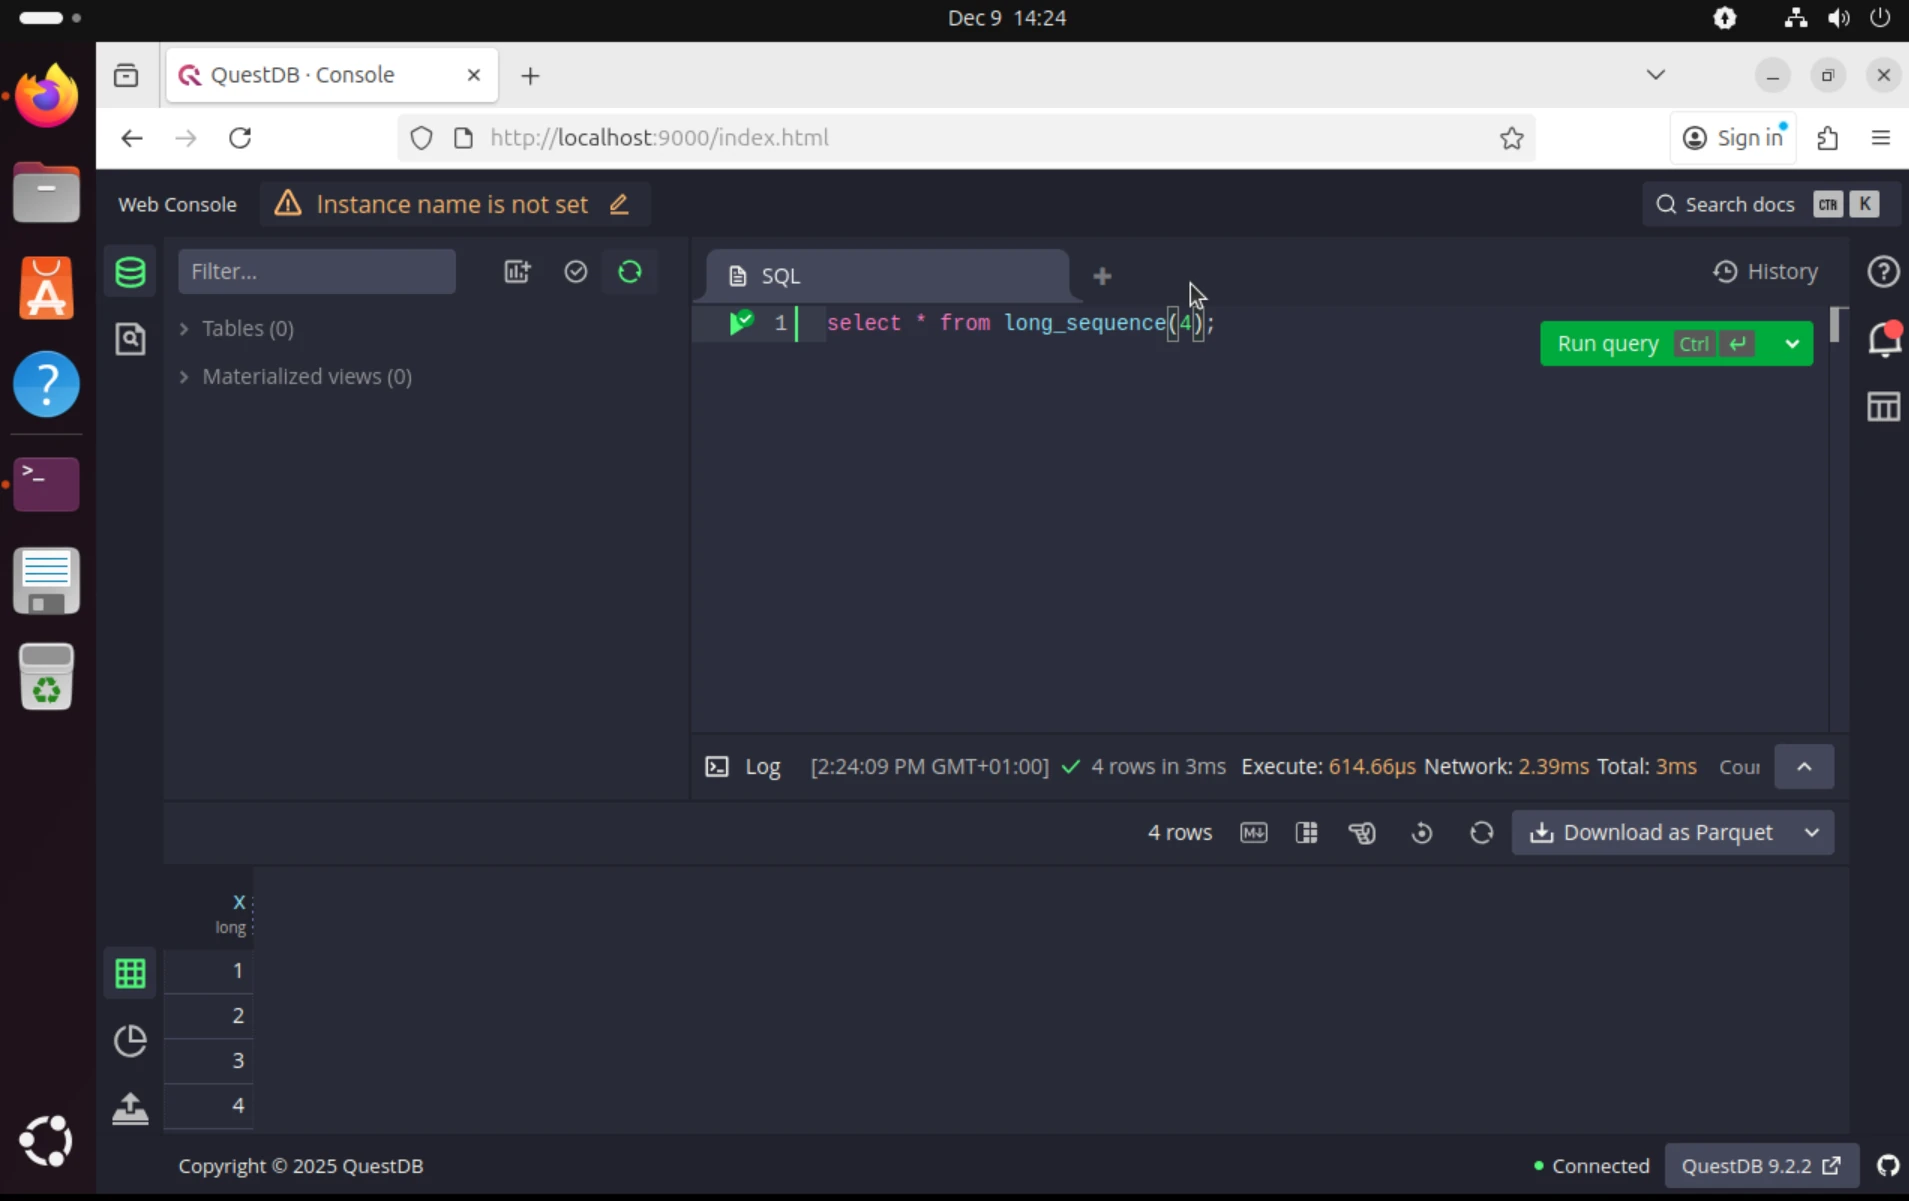
and downloaded, unpacked and started QuestDB:
$ curl -L https://github.com/questdb/questdb/releases/download/9.2.2/questdb-9.2.2-rt-linux-x86-64.tar.gz -o questdb.tar.gz$ tar -xzvf questdb.tar.gz$ cd questdb-9.2.2-rt-linux-x86-64$ ./bin/questdb start
This was meant to validate that QuestDB works in the VM at all. Firefox was already installed in the Ubuntu desktop
edition, so I just opened http://localhost:9000 in Firefox and verified QuestDB web console was up and running.
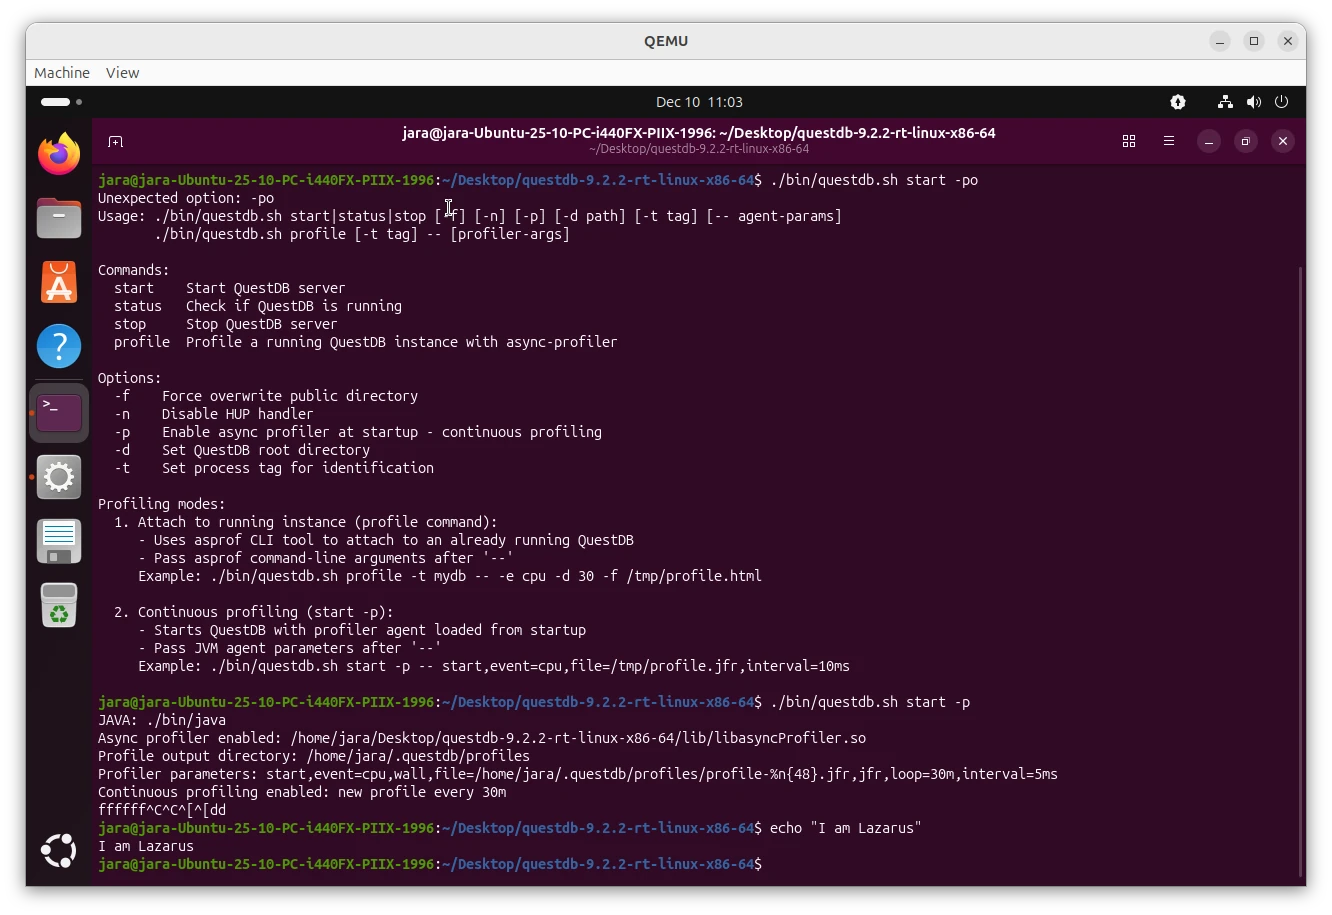
The next step was to stop QuestDB and start it with a profiler attached:
$ ./bin/questdb stop$ ./bin/questdb start -p
At this point, I expected the virtual machine to freeze. However, it didn't. It was responsive as if nothing bad had
happened. That was a bummer. I wanted to see the deadlock in action!
I thought that perhaps QEMU is in a way shielding the virtual machine from the bug. But then I realized that the
default Ubuntu uses paranoia settings that prevent perf_events from working properly and async-profiler falls back to
using ctimer when perf_events are restricted. The kernel bug specifically lives in the perf_events hrtimer
code path, so we must force async-profiler to use that path to trigger the bug.
To fix this, I changed the paranoia settings:
$ echo -1 | sudo tee /proc/sys/kernel/perf_event_paranoid
After this, I restarted QuestDB with the profiler again:
$ ./bin/questdb stop$ ./bin/questdb start -p
And this time, the virtual machine froze as expected! Success! I was able to reproduce the problem in QEMU!
Attaching GDB to QEMU
Now that I was able to reproduce the problem in QEMU, I wanted to attach GDB to the emulated machine to see the deadlock in action.
Let's start GDB on the host machine and connect it to QEMU's built-in GDB server:
$ gdbGNU gdb (Ubuntu 16.3-1ubuntu2) 16.3[...](gdb) target remote :1234Remote debugging using :1234warning: No executable has been specified and target does not supportdetermining executable automatically. Try using the "file" command.0xffffffff82739398 in ?? ()(gdb) info threadsId Target Id Frame* 1 Thread 1.1 (CPU#0 [running]) 0xffffffff82739398 in ?? ()2 Thread 1.2 (CPU#1 [running]) 0xffffffff82739398 in ?? ()3 Thread 1.3 (CPU#2 [running]) 0xffffffff827614d3 in ?? ()4 Thread 1.4 (CPU#3 [running]) 0xffffffff82739398 in ?? ()(gdb) thread apply all bt
Side note: We just casually attached a debugger to a live kernel! How cool is that?
We can see 4 threads corresponding to the 4 CPUs in the VM. The bt command shows the stack traces of all threads, but there is not much useful information since we don't have the kernel symbols loaded in GDB.
Let's fix this. I am lazy again and take advantage of running exactly the same kernel version as the host machine so I can use the host's kernel image and symbol files.
On the host machine, we need to add repositories with debug symbols and install the debug symbols for the running kernel:
echo "deb http://ddebs.ubuntu.com questing main restricted universe multiverse" | sudo tee /etc/apt/sources.list.d/ddebs.listecho "deb http://ddebs.ubuntu.com questing-updates main restricted universe multiverse" | sudo tee -a /etc/apt/sources.list.d/ddebs.listecho "deb http://ddebs.ubuntu.com questing-proposed main restricted universe multiverse" | sudo tee -a /etc/apt/sources.list.d/ddebs.listsudo apt install ubuntu-dbgsym-keyringsudo apt updatesudo apt install linux-image-$(uname -r)-dbgsym
With the debug symbols installed, I started GDB again and loaded the kernel image and symbols:
$ gdb /usr/lib/debug/boot/vmlinux-$(uname -r)GNU gdb (Ubuntu 16.3-1ubuntu2) 16.3[...]gdb) target remote :1234Remote debugging using :12340xffffffff9e9614d3 in ?? ()[...](gdb) info threadsId Target Id Frame* 1 Thread 1.1 (CPU#0 [running]) 0xffffffff9e9614d3 in ?? ()2 Thread 1.2 (CPU#1 [running]) 0xffffffff9e939398 in ?? ()3 Thread 1.3 (CPU#2 [running]) 0xffffffff9e9614d3 in ?? ()4 Thread 1.4 (CPU#3 [running]) 0xffffffff9e9614d3 in ?? ()(gdb) quit
and symbols were still NOT resolved! I had to capitulate and ask a LLM for help. After a bit of brainstorming, we
realized that the kernel is compiled with KASLR enabled, so the kernel is loaded at a random address at each boot.
The simplest way to fix this is to disable KASLR, I could not care less about security in my test VM. To disable KASLR, I edited the GRUB configuration, added the nokaslr parameter, updated GRUB and rebooted the VM:
$ vim /etc/default/grub# Add nokaslr to the GRUB_CMDLINE_LINUX_DEFAULT lineGRUB_CMDLINE_LINUX_DEFAULT="quiet splash nokaslr"$ sudo update-grub$ sudo reboot
Then I set the paranoia settings again, started QuestDB with the profiler and attached GDB again. This time, the symbols were resolved correctly!
$ gdb /usr/lib/debug/boot/vmlinux-$(uname -r)GNU gdb (Ubuntu 16.3-1ubuntu2) 16.3[...](gdb) target remote :1234[...](gdb) info threadsId Target Id Frame* 1 Thread 1.1 (CPU#0 [running]) csd_lock_wait (csd=0xffff88813bd3a460) at /build/linux-8YMEfB/linux-6.17.0/kernel/smp.c:3512 Thread 1.2 (CPU#1 [running]) csd_lock_wait (csd=0xffff88813bd3b520) at /build/linux-8YMEfB/linux-6.17.0/kernel/smp.c:3513 Thread 1.3 (CPU#2 [running]) hrtimer_try_to_cancel (timer=0xffff88802343d028) at /build/linux-8YMEfB/linux-6.17.0/kernel/time/hrtimer.c:13594 Thread 1.4 (CPU#3 [running]) hrtimer_try_to_cancel (timer=0xffff88802343a0e8) at /build/linux-8YMEfB/linux-6.17.0/kernel/time/hrtimer.c:1359
This looks much better! We can see that the first 2 threads are stuck in csd_lock_wait() function, presumably waiting for locks held by the other CPUs
and threads 3 and 4 are in hrtimer_try_to_cancel().
The threads 3 and 4 are the interesting ones since they execute a function related to the kernel bug we are investigating. Let's switch to thread 4 and see its stack trace:
(gdb) thread 4[Switching to thread 4 (Thread 1.4)]#0 hrtimer_try_to_cancel (timer=0xffff88802343a0e8) at /build/linux-8YMEfB/linux-6.17.0/kernel/time/hrtimer.c:13591359 in /build/linux-8YMEfB/linux-6.17.0/kernel/time/hrtimer.c(gdb) bt#0 hrtimer_try_to_cancel (timer=0xffff88802343a0e8) at /build/linux-8YMEfB/linux-6.17.0/kernel/time/hrtimer.c:1359#1 hrtimer_cancel (timer=timer@entry=0xffff88802343a0e8) at /build/linux-8YMEfB/linux-6.17.0/kernel/time/hrtimer.c:1488#2 0xffffffff81700605 in perf_swevent_cancel_hrtimer (event=<optimized out>) at /build/linux-8YMEfB/linux-6.17.0/kernel/events/core.c:11818#3 perf_swevent_cancel_hrtimer (event=0xffff888023439f80) at /build/linux-8YMEfB/linux-6.17.0/kernel/events/core.c:11805#4 cpu_clock_event_stop (event=0xffff888023439f80, flags=0) at /build/linux-8YMEfB/linux-6.17.0/kernel/events/core.c:11868#5 0xffffffff81715488 in __perf_event_overflow (event=event@entry=0xffff888023439f80, throttle=throttle@entry=1, data=data@entry=0xffffc90002cd7cc0, regs=0xffffc90002cd7f48) at /build/linux-8YMEfB/linux-6.17.0/kernel/events/core.c:10338#6 0xffffffff81716eaf in perf_swevent_hrtimer (hrtimer=0xffff88802343a0e8) at /build/linux-8YMEfB/linux-6.17.0/kernel/events/core.c:11774#7 0xffffffff81538a03 in __run_hrtimer (cpu_base=<optimized out>, base=<optimized out>, timer=0xffff88802343a0e8, now=0xffffc90002cd7e58, flags=<optimized out>) at /build/linux-8YMEfB/linux-6.17.0/kernel/time/hrtimer.c:1761#8 __hrtimer_run_queues (cpu_base=cpu_base@entry=0xffff88813bda1400, now=now@entry=48514890563, flags=flags@entry=2, active_mask=active_mask@entry=15) at /build/linux-8YMEfB/linux-6.17.0/kernel/time/hrtimer.c:1825#9 0xffffffff8153995d in hrtimer_interrupt (dev=<optimized out>) at /build/linux-8YMEfB/linux-6.17.0/kernel/time/hrtimer.c:1887#10 0xffffffff813c4ac8 in local_apic_timer_interrupt () at /build/linux-8YMEfB/linux-6.17.0/arch/x86/kernel/apic/apic.c:1039#11 __sysvec_apic_timer_interrupt (regs=regs@entry=0xffffc90002cd7f48) at /build/linux-8YMEfB/linux-6.17.0/arch/x86/kernel/apic/apic.c:1056#12 0xffffffff82621724 in instr_sysvec_apic_timer_interrupt (regs=0xffffc90002cd7f48) at /build/linux-8YMEfB/linux-6.17.0/arch/x86/kernel/apic/apic.c:1050#13 sysvec_apic_timer_interrupt (regs=0xffffc90002cd7f48) at /build/linux-8YMEfB/linux-6.17.0/arch/x86/kernel/apic/apic.c:1050#14 0xffffffff81000f0b in asm_sysvec_apic_timer_interrupt () at /build/linux-8YMEfB/linux-6.17.0/arch/x86/include/asm/idtentry.h:574#15 0x00007b478171db80 in ?? ()#16 0x0000000000000001 in ?? ()#17 0x0000000000000000 in ?? ()
We can see the exact sequence of function calls leading to the deadlock: hrtimer_try_to_cancel() called from cpu_clock_event_stop(), called from __perf_event_overflow(), called from perf_swevent_hrtimer().
This matches our understanding of the bug perfectly! This is the infinite loop in hrtimer_cancel() that causes the
deadlock.
Forensics and Playing God
Okay, I have to admit that seeing a kernel stack trace is already somewhat satisfying, but we have a live (well, half-dead) kernel under a debugger. Let's have some fun. I want to touch the deadlock and understand why it took down the whole machine, and see if we can perform a miracle and bring it back to life.
Confirming the suspect
We know hrtimer_cancel is waiting for a callback to finish. But which callback? The stack trace says perf_swevent_cancel_hrtimer,
but let's verify the hrtimer struct in memory actually points to the function we blame.
I switched to the stuck thread (Thread 4 in my case) and looked at frame #0:
(gdb) thread 4[Switching to thread 4 (Thread 1.4)]#0 hrtimer_try_to_cancel (timer=0xffff88802343a0e8) at /build/linux-8YMEfB/linux-6.17.0/kernel/time/hrtimer.c:13591359 in /build/linux-8YMEfB/linux-6.17.0/kernel/time/hrtimer.c(gdb) frame 0#0 hrtimer_try_to_cancel (timer=0xffff88802343a0e8) at /build/linux-8YMEfB/linux-6.17.0/kernel/time/hrtimer.c:13591359 in /build/linux-8YMEfB/linux-6.17.0/kernel/time/hrtimer.c(gdb) print *timer$1 = {node = {node = {__rb_parent_color = 18446612682661667048, rb_right = 0x0, rb_left = 0x0}, expires = 48514879474}, _softexpires = 48514879474, function = 0xffffffff81716dd0 <perf_swevent_hrtimer>, base = 0xffff88813bda1440, state = 0 '\000', is_rel = 0 '\000', is_soft = 0 '\000', is_hard = 1 '\001'}
Let me explain these GDB commands: frame 0 selects the innermost stack frame - the function currently executing.
In a backtrace, frame 0 is the current function, frame 1 is its caller, frame 2 is the caller's caller, and so on.
By selecting frame 0, I can inspect local variables and parameters in hrtimer_try_to_cancel().
The print *timer command dereferences the timer pointer and displays the contents of the struct hrtimer:
struct hrtimer {struct timerqueue_node node;ktime_t _softexpires;enum hrtimer_restart (*function)(struct hrtimer *);struct hrtimer_clock_base *base;u8 state;u8 is_rel;u8 is_soft;u8 is_hard;};
The key field here is function - a pointer to a callback function that takes a struct hrtimer * and returns
enum hrtimer_restart. This callback is invoked when the timer fires. GDB shows it points to 0xffffffff81716dd0 and helpfully resolves this address to perf_swevent_hrtimer. Since we're currently inside perf_swevent_hrtimer (look at frame #6 in our backtrace above), this confirms the self-deadlock: the timer is trying to cancel itself while its own callback is still running!
The Mystery of the "Other" CPUs
One question remained: If CPUs 3 and 4 are deadlocked in a loop, why did the entire machine freeze? Why couldn't I just SSH in and kill the process?
The answer lies in those other threads we saw earlier, stuck in csd_lock_wait:
(gdb) thread 1[Switching to thread 1 (Thread 1.1)]#0 csd_lock_wait (csd=0xffff88813bd3a460) at /build/linux-8YMEfB/linux-6.17.0/kernel/smp.c:351warning: 351 /build/linux-8YMEfB/linux-6.17.0/kernel/smp.c: No such file or directory
CSD stands for Call Function Single Data. In Linux, when one CPU wants another CPU to do something (like flush a TLB
or stop a perf_event), it sends an IPI (Inter-Processor Interrupt).
If the target CPU is busy with interrupts disabled (which is exactly the case for our deadlocked CPUs 3 and 4), it never responds.
The sender (CPU 0) sits there spinning, waiting for the other CPU to say "Done!". Eventually, all CPUs end up waiting for the stuck CPUs and the entire system grinds to a halt.
Performing a Kernel Resurrection
This is the part where the real black magic starts. We know the kernel is stuck in this loop in hrtimer_cancel:
do {ret = hrtimer_try_to_cancel(timer);} while (ret < 0);
As long as hrtimer_try_to_cancel returns -1 (which it does, because the callback is running), the loop continues
forever.
But we have GDB. We can change reality.
If we force the function to return 0 (meaning "timer not active"), the loop should break, cpu_clock_event_stop
should finish, and the kernel should unfreeze. It might crash 1 millisecond later because we left the timer in an
inconsistent state, but perhaps it's worth trying.
First, let's double-check we are in the innermost frame, inside hrtimer_try_to_cancel:
(gdb) thread 4[Switching to thread 4 (Thread 1.4)]#0 hrtimer_try_to_cancel (timer=0xffff88802343a0e8) at /build/linux-8YMEfB/linux-6.17.0/kernel/time/hrtimer.c:1359warning: 1359 /build/linux-8YMEfB/linux-6.17.0/kernel/time/hrtimer.c: No such file or directory(gdb) frame 0#0 hrtimer_try_to_cancel (timer=0xffff88802343a0e8) at /build/linux-8YMEfB/linux-6.17.0/kernel/time/hrtimer.c:13591359 in /build/linux-8YMEfB/linux-6.17.0/kernel/time/hrtimer.c
Use the GDB finish command to let the function run to completion and pause right when it returns to the caller:
(gdb) finish
We are now sitting at line 1490, right at the check if (ret < 0).
int hrtimer_cancel(struct hrtimer *timer){int ret;do {ret = hrtimer_try_to_cancel(timer);if (ret < 0) // <-- we are herehrtimer_cancel_wait_running(timer);} while (ret < 0);return ret;}
On x86_64, integer return values are passed in the %rax register.
Since hrtimer_try_to_cancel returns an int (32-bit), we can use $eax (the lower 32 bits of %rax):
(gdb) print $eax$2 = -1
Exactly as expected. -1 means the timer callback is running, so the loop will continue.
But since the CPU is paused, we can overwrite this value. We can lie to the kernel and tell it the timer was
successfully cancelled (return code 1) or inactive (return code 0). I chose 0.
(gdb) set $eax = 0(gdb) print $eax$3 = 0
I crossed my fingers and unpaused the VM:
(gdb) continueContinuing.
And it did nothing. The VM was still frozen. Let's see what is going on:
(gdb) info threadsId Target Id Frame1 Thread 1.1 (CPU#0 [running]) csd_lock_wait (csd=0xffff88813bd3a460) at /build/linux-8YMEfB/linux-6.17.0/kernel/smp.c:3512 Thread 1.2 (CPU#1 [running]) csd_lock_wait (csd=0xffff88813bd3b520) at /build/linux-8YMEfB/linux-6.17.0/kernel/smp.c:3513 Thread 1.3 (CPU#2 [running]) hrtimer_try_to_cancel (timer=0xffff88802343d028) at /build/linux-8YMEfB/linux-6.17.0/kernel/time/hrtimer.c:1359* 4 Thread 1.4 (CPU#3 [running]) csd_lock_wait (csd=0xffff88813bd3b560) at /build/linux-8YMEfB/linux-6.17.0/kernel/smp.c:351
Now, thread 4 is also stuck in csd_lock_wait, just like threads 1 and 2. We managed to escape from the infinite
loop in thread 4, but thread 3 is still stuck in hrtimer_try_to_cancel.
We could try the same trick on thread 3, but would this be enough to unfreeze the entire system? For starters, we tricked the kernel into thinking the timer was inactive, but in reality it is still active. This is very thin ice to skate on - we might have just created more problems for ourselves. And more importantly, even if the kernel could escape the deadlock, the profiler would immediately try to re-arm the timer again, leading us back into the same deadlock.
So I decided to give up on the resurrection attempt. The kernel was stuck, but at least I understood the problem now and I was pretty happy with my newly acquired kernel debugging skills.
Conclusion
While I couldn't perform a miracle and resurrect the frozen kernel, I walked away with a much deeper understanding
of the machinery behind Linux perf_events and hrtimers. I learned how to set up QEMU for kernel debugging, how to attach GDB to a live kernel, and how to inspect kernel data structures in memory.
For QuestDB users, the takeaway is simple: if you are on a kernel version 6.17, use the -e ctimer flag when
profiling. It bypasses the buggy perf_events hrtimer path entirely. Or just wait for either the kernel fix to land
in your distro or the next QuestDB release, which will include an
async-profiler version that works around this issue.
As for me, I’m going back to my code. The next time my machine freezes, I might just reboot it like a normal person. But where is the fun in that?
Addendum: The Second Resurrection Attempt
After writing this post, I kept thinking about that failed resurrection attempt. We got so close: We broke one CPU out of the deadlock, but the other was still stuck. I should have tried harder! So I started QEMU again, reproduced the deadlock, and this time came with a plan: use GDB to force kernel to kill the QuestDB Java process, so the profiler can't re-arm the timer.
First, I needed to find the Java process. The perf_event structure has an owner field pointing to the task that created it:
(gdb) print event->owner$1 = (struct task_struct *) 0xffff88810b2ed100(gdb) print ((struct task_struct *)0xffff88810b2ed100)->comm$2 = "java"(gdb) print ((struct task_struct *)0xffff88810b2ed100)->pid$3 = 4488
Great, we found the Java process with PID 4488. Now, how do you kill a process when the kernel is deadlocked and can't process signals?
You store the signal directly in memory. SIGKILL is signal 9, which means bit 8 in the signal bitmask:
(gdb) set ((struct task_struct *)0xffff88810b2ed100)->signal->shared_pending.signal.sig[0] = 0x100
With the pending kill signal in place, I broke the deadlock loop as before. The system hit another deadlock - a different CPU was now stuck waiting for a spinlock. The lock value showed it was held:
(gdb) print *((unsigned int *)0xffff88813bda1400)$4 = 1
I forcibly released the lock (what could possibly go wrong?):
(gdb) set *((unsigned int *)0xffff88813bda1400) = 0
Then broke another hrtimer loop on a different CPU. It was like playing whack-a-mole with deadlocks - each Java thread had its own perf_event, and they were all hitting the same bug.
After a few rounds of this, I ran continue and checked the threads:
(gdb) continueContinuing.^CThread 4 received signal SIGINT, Interrupt.0xffffffff82621d8b in pv_native_safe_halt () at /build/linux-8YMEfB/linux-6.17.0/arch/x86/kernel/paravirt.c:82(gdb) info threadsId Target Id Frame1 Thread 1.1 (CPU#0 [halted ]) 0xffffffff82621d8b in pv_native_safe_halt () at /build/linux-8YMEfB/linux-6.17.0/arch/x86/kernel/paravirt.c:822 Thread 1.2 (CPU#1 [halted ]) 0xffffffff82621d8b in pv_native_safe_halt () at /build/linux-8YMEfB/linux-6.17.0/arch/x86/kernel/paravirt.c:823 Thread 1.3 (CPU#2 [halted ]) 0xffffffff82621d8b in pv_native_safe_halt () at /build/linux-8YMEfB/linux-6.17.0/arch/x86/kernel/paravirt.c:82* 4 Thread 1.4 (CPU#3 [halted ]) 0xffffffff82621d8b in pv_native_safe_halt () at /build/linux-8YMEfB/linux-6.17.0/arch/x86/kernel/paravirt.c:82(gdb) continue
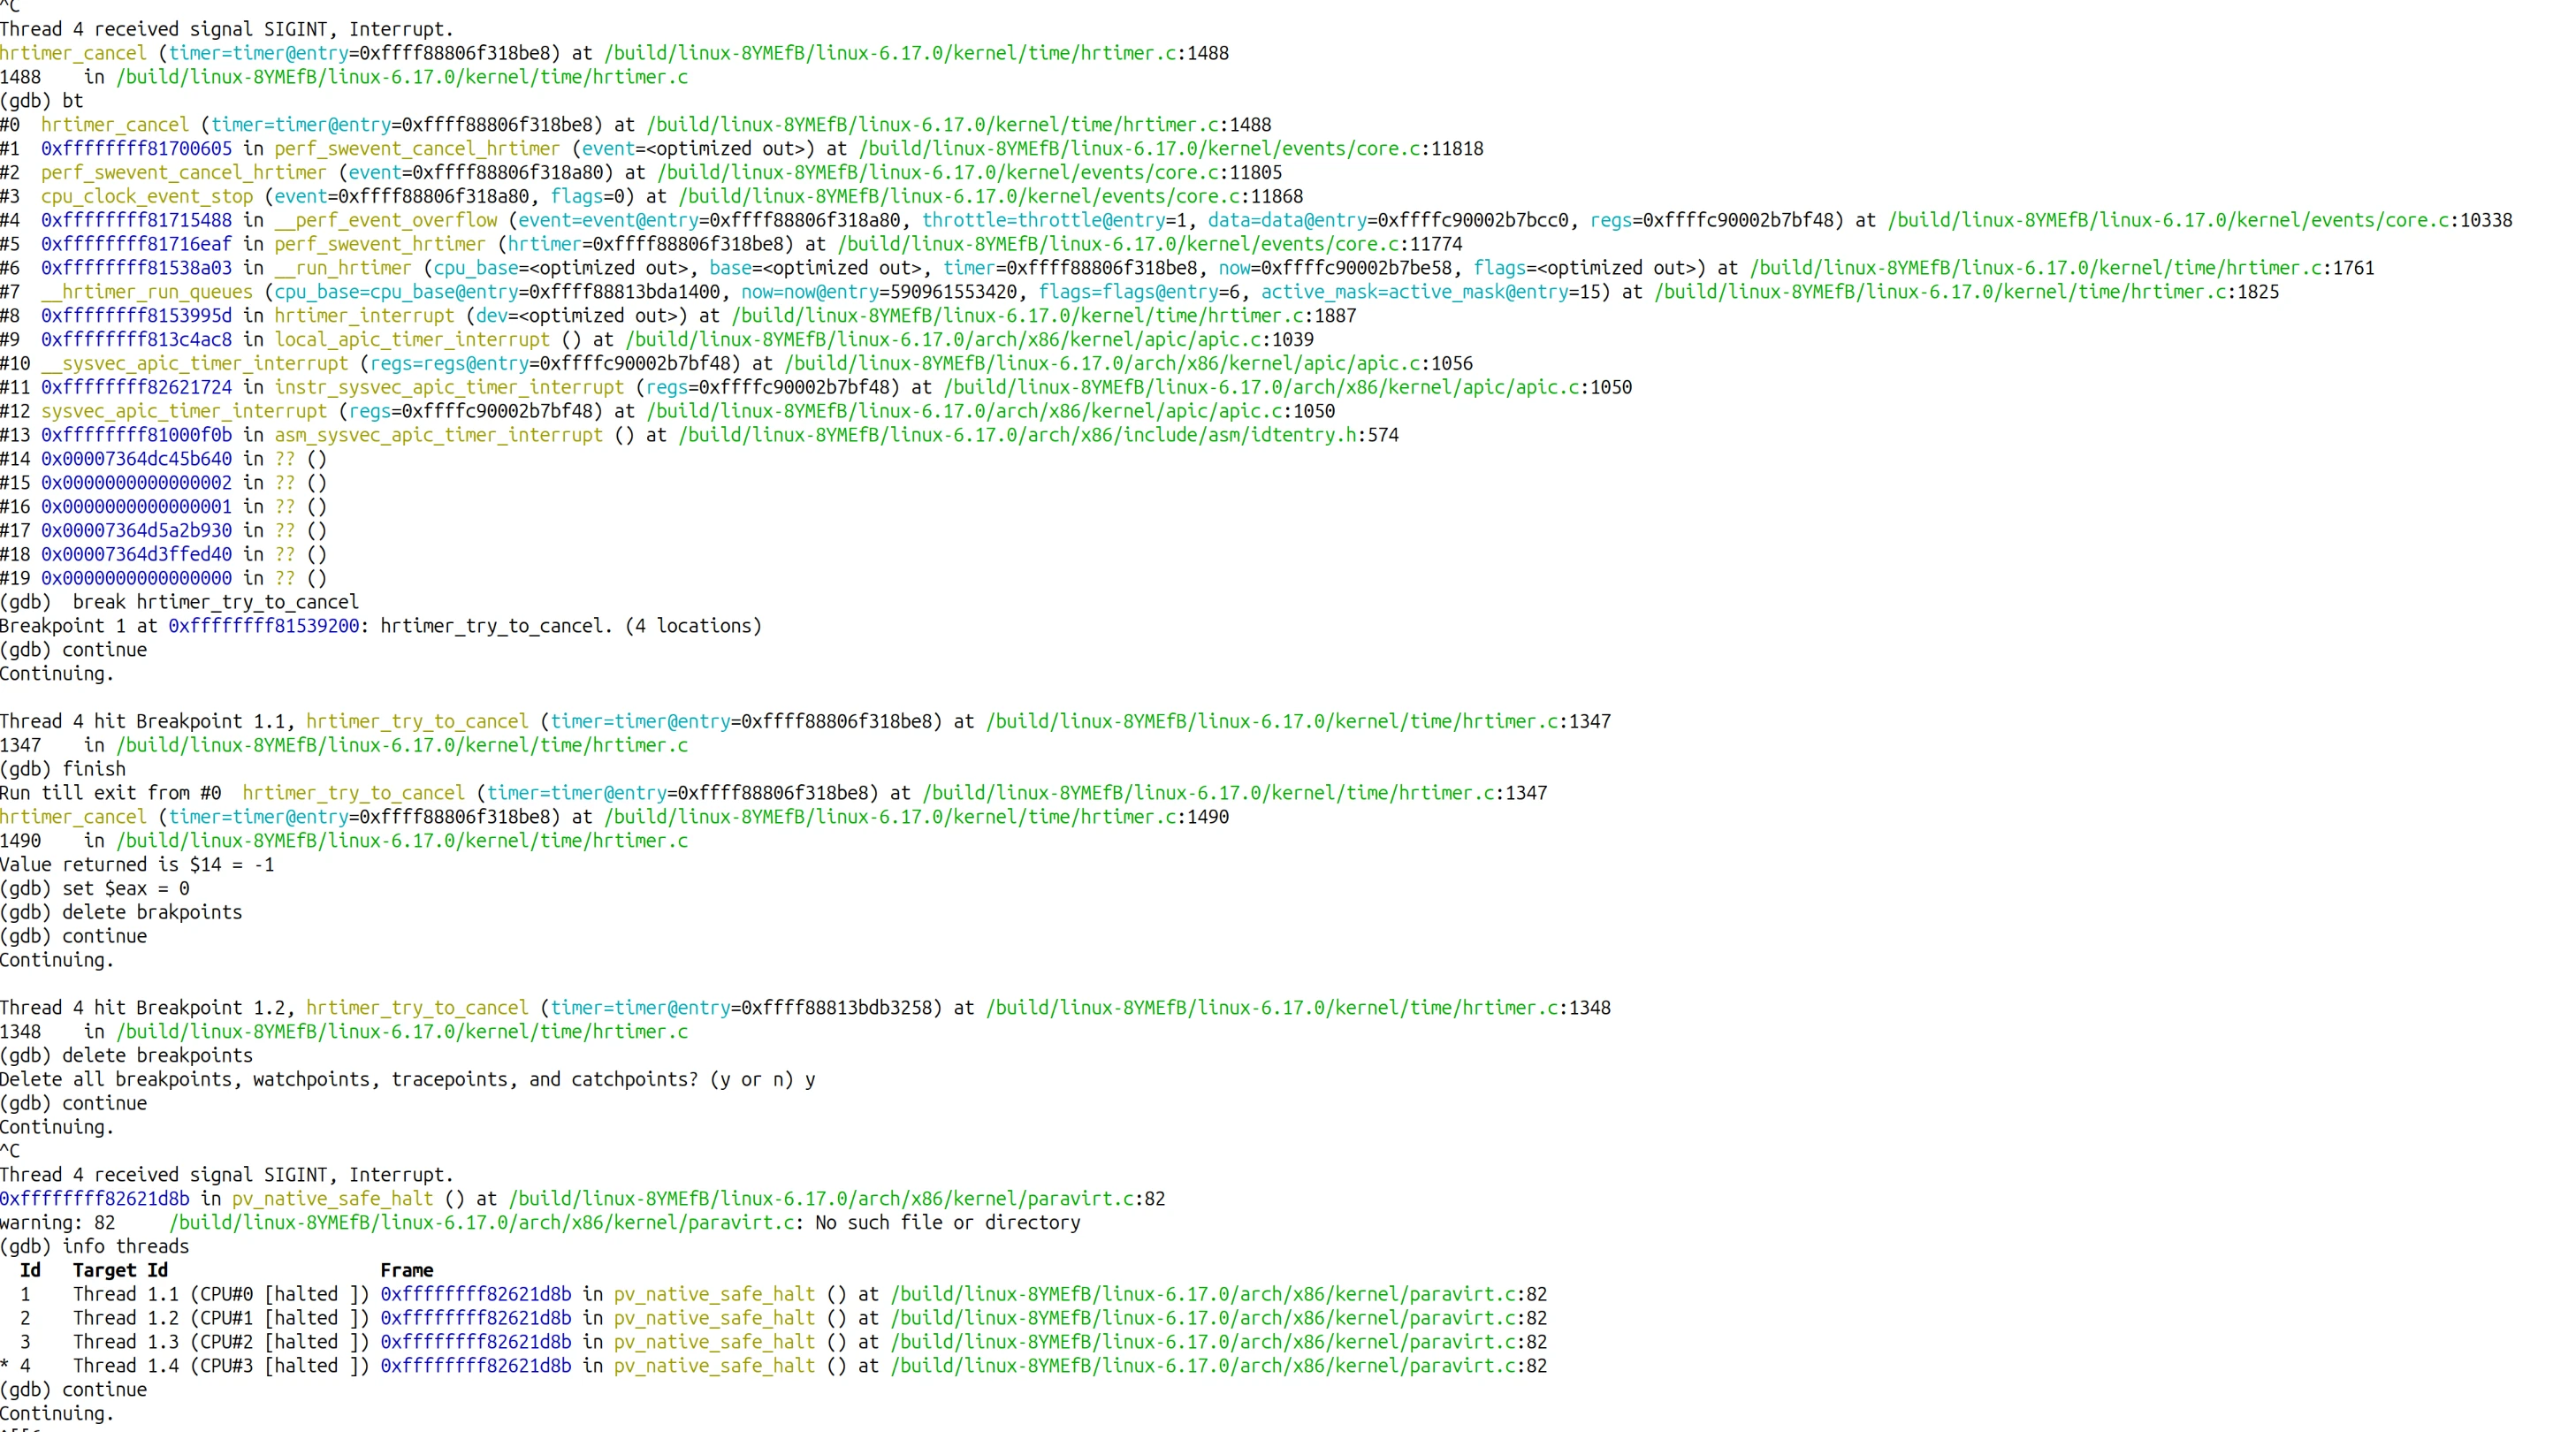
I looked at the QEMU window. The desktop was responsive. The mouse moved. Java was gone - killed by the SIGKILL we planted before breaking the deadlock.
We actually did it. We resurrected a kernel-deadlocked machine by lying to it about return values, forcibly releasing locks, and planting signals in process memory.
Would I recommend this in production (or anywhere outside a lab)? Absolutely not. But was it fun? Totally!