Schema Explorer
The Schema Explorer is the navigation panel on the left side of the Web Console that helps you browse and understand your database structure. It provides a hierarchical view of all tables and materialized views with detailed information about their columns, data types, storage configuration, and relationships.
You can toggle the Schema Explorer by using the database icon on the left.

Tree View
The Schema Explorer displays database objects in an expandable tree structure. When you expand a table or materialized view, the following information is available:
Folders
Columns
All table columns are displayed with their names and data types, each represented by type-specific icons:
- Designated Timestamp: The designated timestamp column is highlighted with a distinctive green-colored icon
- Symbol Columns: Distinguished by tag icons, these can be further expanded to reveal:
- Indexed: Indicates whether the symbol column has an index for faster filtering
- Symbol Capacity: The maximum number of distinct symbols that can be stored (e.g., 256)
- Cached: Shows whether symbol values are cached in memory for improved performance
Storage Details
- Partitioning: Displays the table's partitioning approach (e.g., "By day", "By week", "None")
- WAL: Indicates whether Write-Ahead Log is enabled or disabled for the table
Table and materialized view icons visually indicate key storage details such as partitioning and WAL status. Hover over these icons to see detailed information including partitioning strategy, ordering configuration, and WAL status, allowing you to quickly assess critical storage details without expanding the full table structure.
Base Tables
For materialized views, shows the underlying source tables
Context Menu
Right-clicking on any table or materialized view opens a context menu with the following actions:
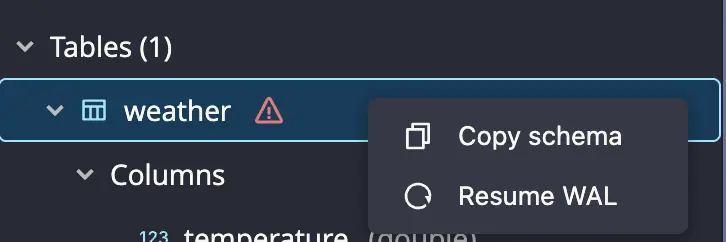
- Copy schema: Copies the schema of the table to the clipboard
- Resume WAL: If WAL is suspended for a table, a warning icon is shown to the right of the table name. You can resume WAL from a specific transaction number by clicking on the context menu item.
When a materialized view is invalid, a warning icon is shown to the right of the materialized view name. You can see the invalidation reason by hovering over the icon.
Keyboard Navigation
You can navigate in the tree view using arrow keys, Home, End, Page Up, and Page Down.
Toolbar
The toolbar provides essential actions for filtering, managing, and interacting with your database objects.

Filter
Type to filter tables and materialized views by name.
Suspended Tables
When tables have suspended WAL operations, an error icon with a count of suspended tables appears. Click to filter and show only suspended tables.
Table Management Actions
- Add Metrics: Chart icon button to add metrics for monitoring database performance. See Metrics View for details.
- Select Mode: Checkbox circle icon to enter table selection mode for copying multiple schemas to the clipboard.
- Auto Refresh: Refresh icon to toggle automatic updates of the schema explorer when database structure changes. Disabling auto refresh is recommended only for development purposes.