Web Console overview
The QuestDB Web Console is a browser-based SQL client bundled with every QuestDB instance. Write and run SQL, explore your schema, build notebook dashboards with live charts, bring in AI assistance, and monitor ingestion, all without installing anything.
Accessing the Web Console
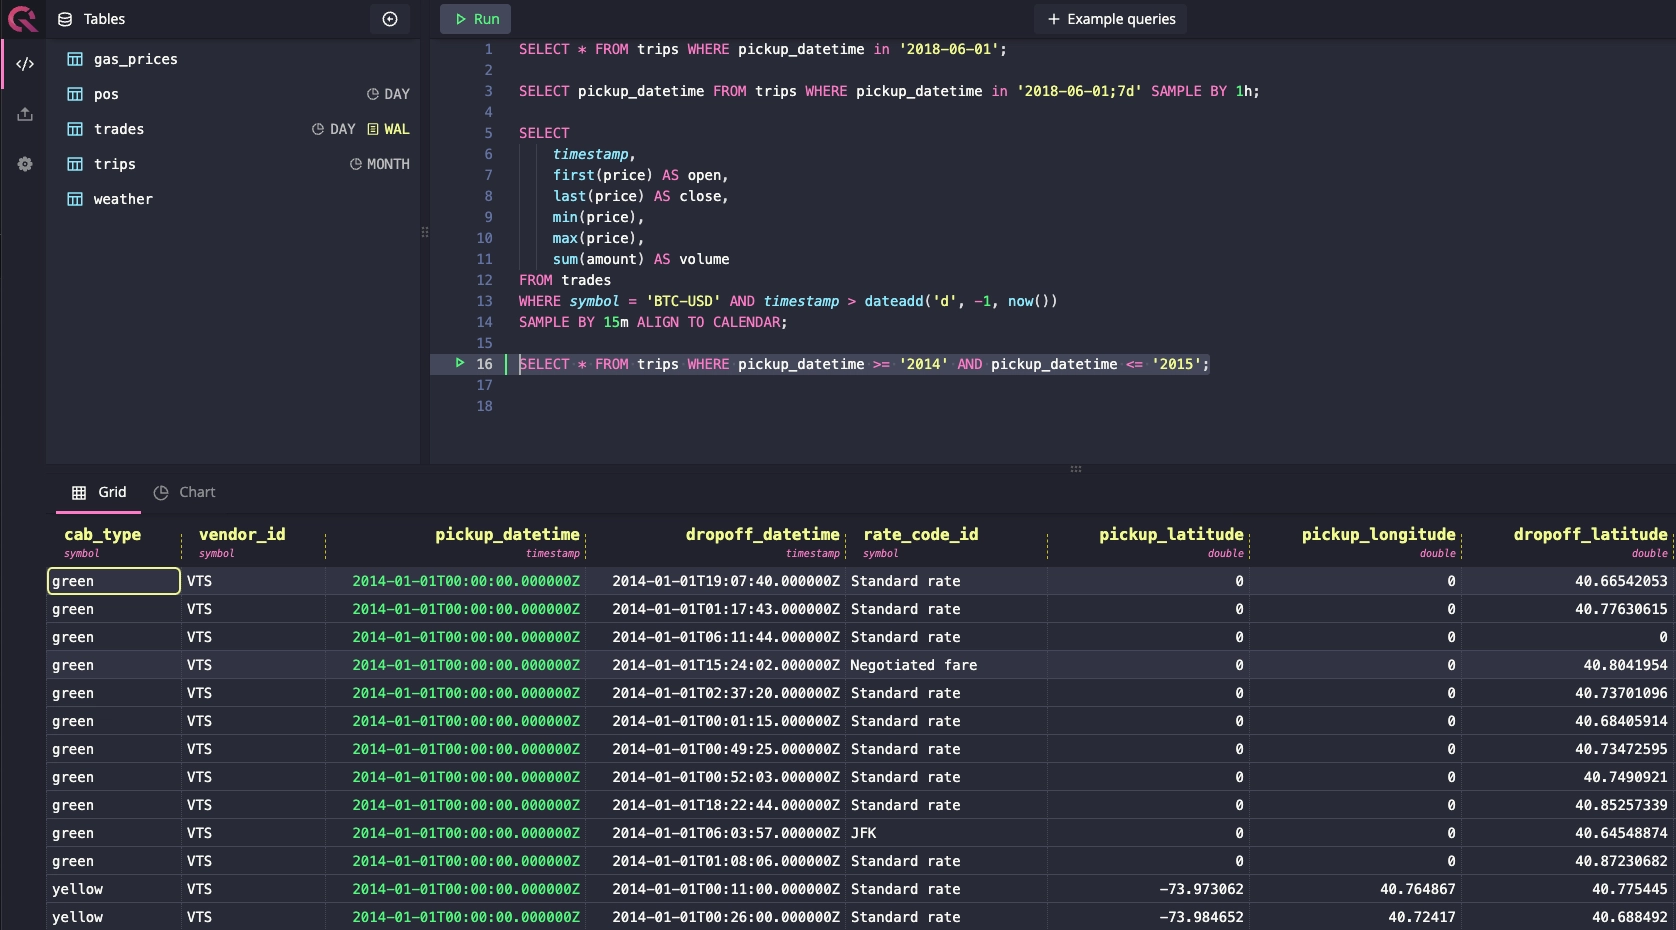
The Web Console is available at http://[server-address]:9000. When
running locally, this is http://localhost:9000.
Layout
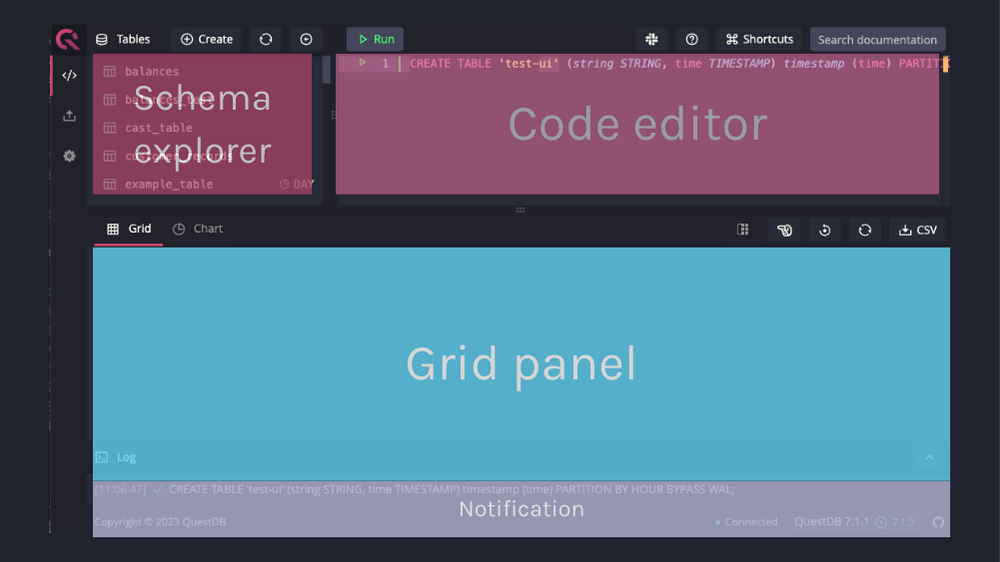
The Schema Explorer sits on the left, the editor and notebook tabs in the center with the Result Grid and Query Log below them, and the right sidebar holds quick tools such as the AI Assistant and Table Details.
The Web Console is organized into the following main sections that work together to provide a complete workflow:
Code Editor
The Code Editor is where you write and execute SQL queries with features like syntax highlighting, auto-completion, and error tracing. It supports executing queries by selection, multiple query execution, and query planning.
Learn more about the Code Editor →
Notebooks
Notebooks combine SQL cells, markdown notes, and live charts in a single tab. Use them to explore data step by step, or flip to the grid layout and arrange cells into an auto-refreshing dashboard.
QuestDB MCP Server
The official QuestDB MCP server (@questdb/mcp-server-questdb) links AI coding agents such as Claude Code or Codex to your running Web Console. Agents explore schemas, run SQL, and build notebook dashboards through your browser session, with a four-level permission model controlling what they can see and do.
Learn more about the QuestDB MCP server →
AI Assistant
The built-in AI Assistant generates, explains, and fixes SQL, answers questions about your schema, and creates notebooks and dashboards from natural-language prompts. It is bring-your-own-key: you connect OpenAI, Anthropic, custom providers, or local models such as Ollama, and your keys and data remain under your control.
Learn more about the AI Assistant →
Metrics View
The Metrics View provides real-time monitoring and telemetry capabilities for your QuestDB instance. It displays interactive charts and widgets to track database performance, WAL operations, and table-specific metrics.
Learn more about the Metrics View →
Schema Explorer
The Schema Explorer is the navigation hub for exploring tables and materialized views. It provides detailed information about each database object including columns with data types, storage configuration (partitioning and WAL status), and for materialized views, their base tables.
Learn more about the Schema Explorer →
Table Details
The Table Details panel provides real-time monitoring and detailed metadata for any table or materialized view. It includes health status indicators, WAL ingestion metrics such as pending rows and transaction lag, performance alerts, and a full view of the table's DDL, columns, and storage configuration.
Learn more about Table Details →
Result Grid
The Result Grid displays your query results in an interactive table format with features for data navigation, export, and visualization.
Learn more about the Result Grid →
Query Log
The Query Log monitors query execution status and performance metrics, providing real-time feedback and maintaining a history of recent operations. It shows execution times, row counts, and detailed error information to help optimize your queries.
Learn more about the Query Log →
Import CSV
The Import CSV interface allows you to upload and import CSV files into QuestDB with automatic schema detection, flexible configuration options, and detailed progress tracking. You can create new tables or append to existing ones with full control over the import process.
Right Sidebar
The Right Sidebar provides quick access to essential tools and information:
- Help: Access quick links and contact options through a convenient help menu
- AI Assistant: Open AI Assistant chat window and manage conversations
- QuestDB News: Stay up-to-date with the latest QuestDB announcements and updates
- Table Details: Monitor real-time ingestion metrics and health status, view metadata for any table or materialized view.
Instance naming
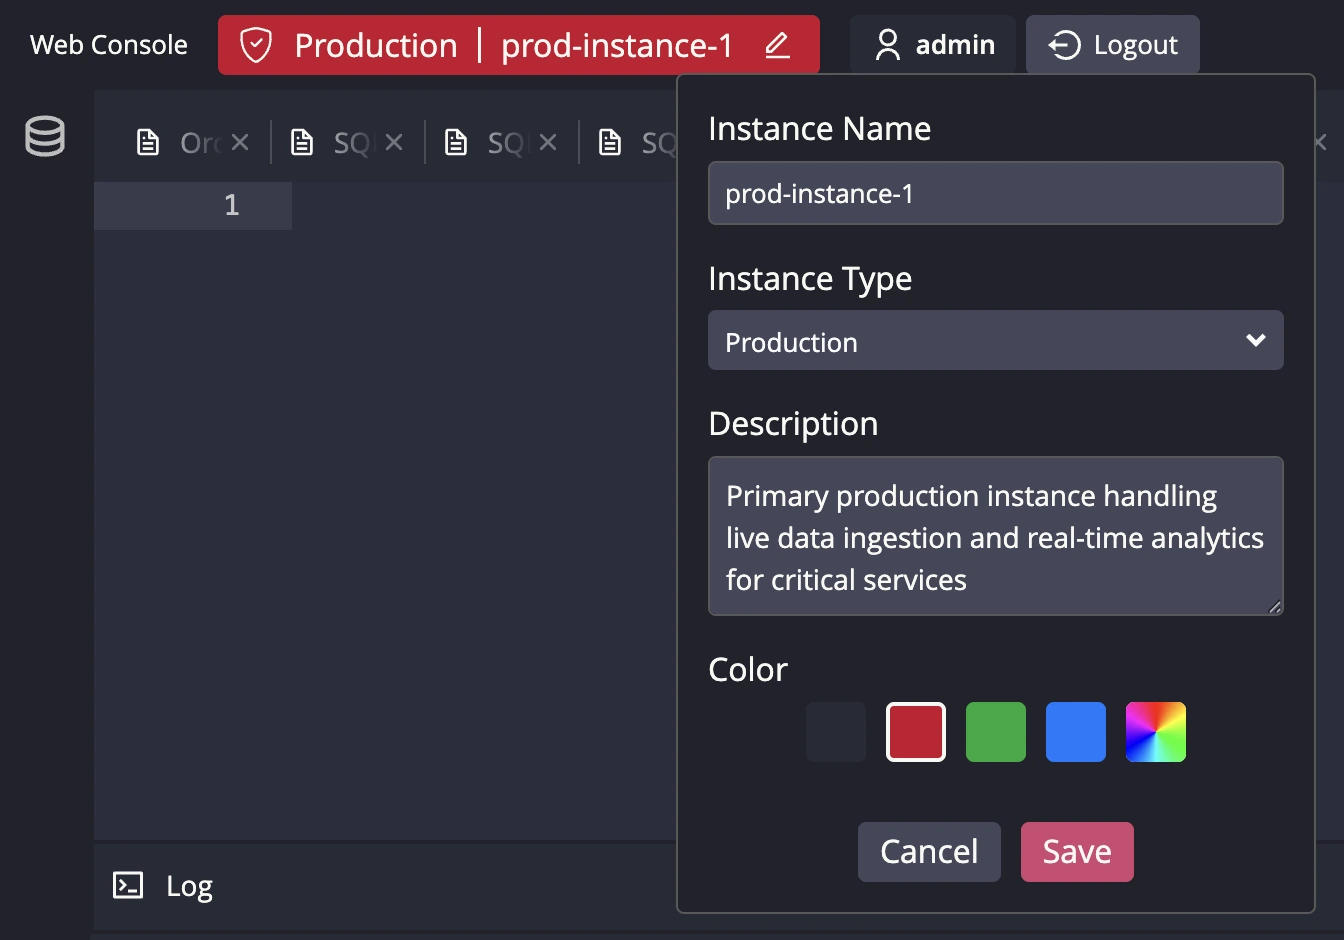
Web Console allows you to set the instance name, type, and color. This functionality is particularly useful for production users who manage multiple deployments and frequently navigate between them. This feature makes it easier to keep track of instance information and label instances with meaningful names for their users.
The instance name, instance type, and description are displayed when hovering over the icon in the instance information badge.
Instance information can be modified through the dialog that opens when clicking the edit icon:
If http.settings.readonly configuration is set to true, instance information is not editable.
When using QuestDB Enterprise with Role-Based Access Control (RBAC), only the users with SETTINGS or DATABASE ADMIN permission can edit the instance information. See Database Permissions for more details.