Query Log
The Query Log displays execution status, performance metrics, and detailed information about your query operations in the bottom panel of the Web Console. It provides real-time feedback on query execution and maintains a history of operations for each tab.
Expansion and Collapse
The Query Log can be toggled between two display modes:
Collapsed Mode (Default)
- Shows the status for the query in cursor
- Displays as a compact single-line summary
Expanded Mode
- Shows the complete history of executed queries for the current tab
- Displays detailed execution information for each query
- Provides access to the "Clear query log" button
Click the button in the top-right corner to switch between modes.
Active Item and Cursor Position
The Query Log is dynamically connected to your editor cursor position:
- Active Query: The highlighted query in the log changes based on where your cursor is positioned in the editor
- Error Markers: Error indicators in the editor are synchronized with the query log entries
- Status Updates: Moving your cursor between different queries automatically updates the active notification
This integration ensures that the Query Log always shows relevant information for the query you're currently working on, making debugging and performance analysis more efficient.
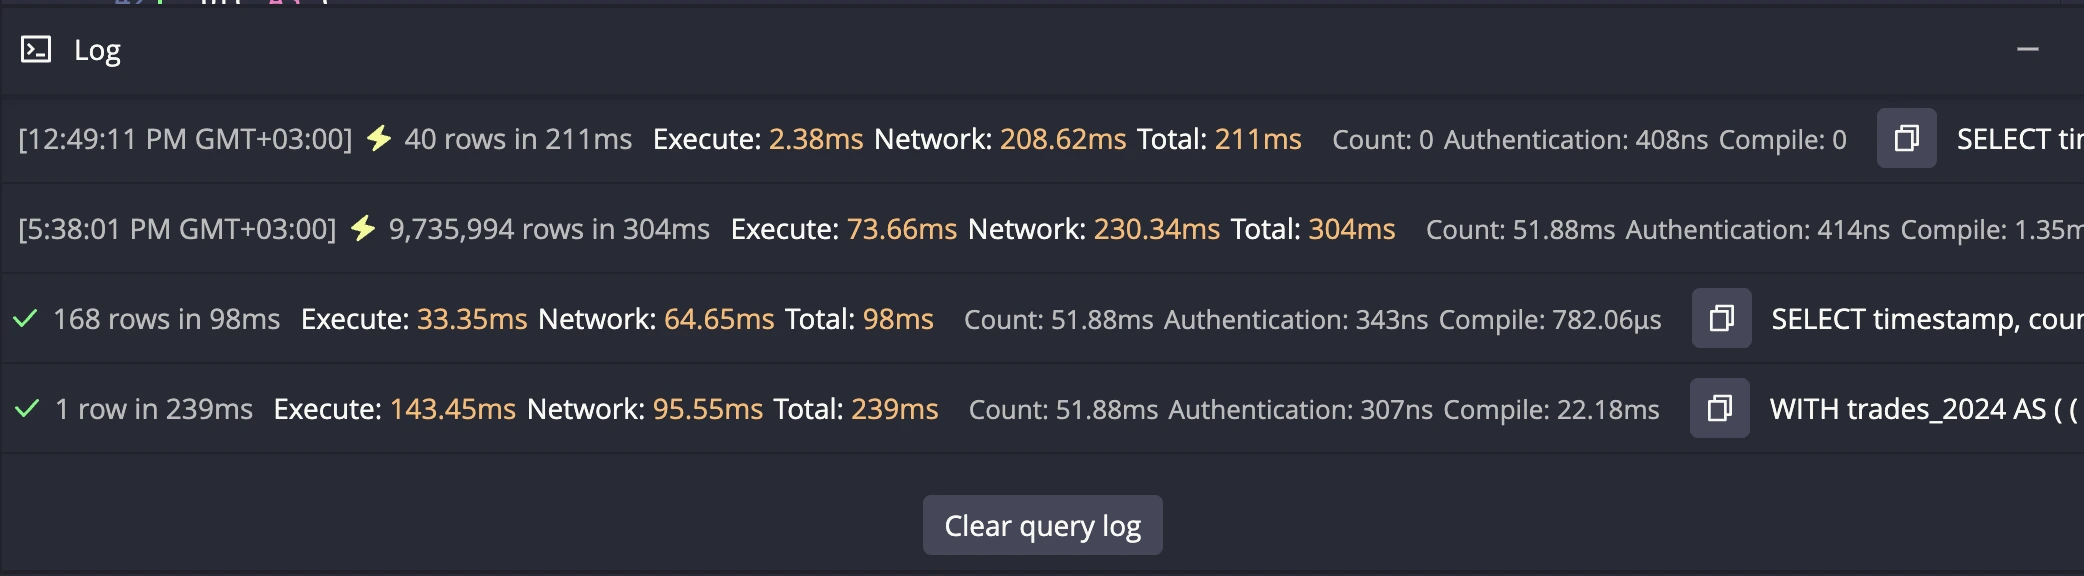
Execution Details
The Query Log provides comprehensive performance metrics for each executed query:
- Row Count: Number of rows returned by SELECT queries
- Execution Time: Time spent by QuestDB processing your query
- Network Time: Time spent transferring data between client and server
- Total Time: Complete end-to-end time from query submission to result display
Example: 9,735,994 rows in 304ms Execute: 73.66ms Network: 230.34ms Total: 304ms
Additional timing details include:
- Count: Time spent counting rows
- Authentication: Time spent on authentication
- Compile: Time spent compiling the query
Copy Query Text
Each query log entry includes a copy button that allows you to copy the executed SQL query text to your clipboard.
Clear Query Log
The "Clear query log" button removes all query execution history for the current tab. This action:
- Removes all notifications and execution history
- Clears error markers from the editor
- Operates per tab - each tab maintains its own independent query log