Metrics View
The Metrics View provides real-time monitoring capabilities for your QuestDB instance. It displays interactive charts and widgets that help you track database performance, WAL operations, and table-specific metrics.
Prerequisites
To use the Metrics View, you must enable telemetry on your QuestDB server:
Server Configuration
Set the following in your server.conf file:
telemetry.enabled=true
Environment Variable
Alternatively, set the environment variable:
QDB_TELEMETRY_ENABLED=true
After making these changes, restart your QuestDB server to enable telemetry collection.
Adding a Metrics Tab
Click the "Add metrics" button (chart icon) in the Schema Explorer toolbar. A new metrics tab will automatically open with the default interface.
Metrics tabs are visually distinguished by their chart icon and blue color scheme in the tab bar. The "+" button in the tab bar creates new SQL editor tabs, not metrics tabs.
Toolbar
The Metrics View toolbar provides comprehensive controls for managing your monitoring experience.

- Add Widget: Opens a modal to select the type of metric for the widget
- Refresh All Widgets: Manually refreshes all widgets to get the latest data
- Refresh Rate: Choose automatic refresh intervals:
- Off: No automatic refresh
- 1s, 5s, 10s, 30s, 1m: Fixed refresh intervals
- Auto: Intelligent refresh rate based on selected time range
- Date/Time Picker: Select custom time ranges for data analysis:
- Predefined ranges: Last 5m, 15m, 1h, 3h, 6h, 12h, 24h, 3 days, 7 days
- Custom ranges: Select specific start and end times
- View Mode Toggle: Switch between Grid and List layouts
Widget
Each widget in the Metrics View provides comprehensive customization options.
- Table Name: Input field for selecting which table to monitor
- Color Customization: Changes chart line colors for better visualization
- Interactive Charts: Allows you to explore data by moving the mouse over the chart
- Remove Widget: Deletes widgets that are no longer needed
Available Metrics
The Metrics View supports several types of widgets, each providing specific insights:
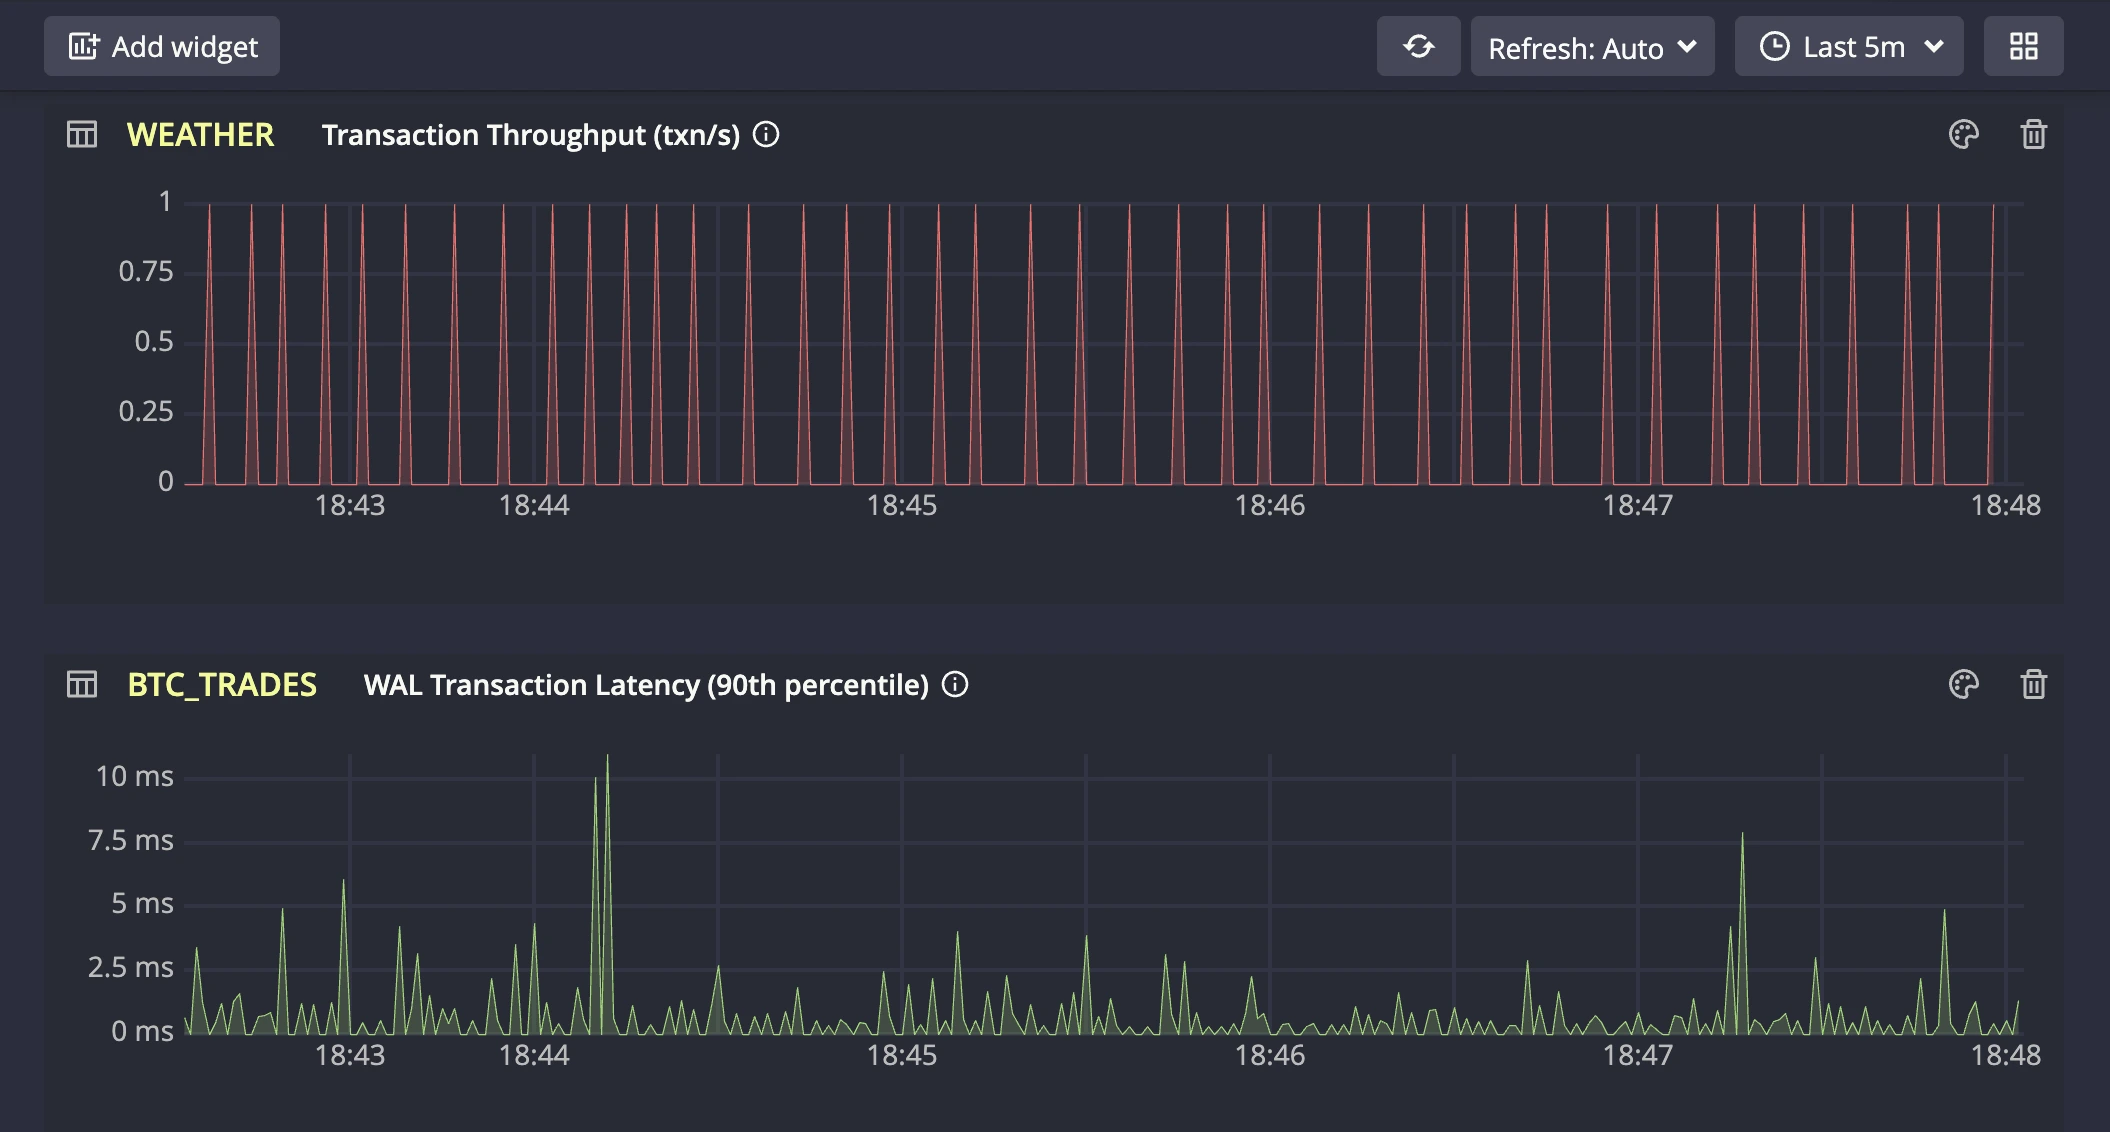
WAL Transaction Throughput (txn/s)
This metric monitors the rate at which transactions are applied to tables. Performance is influenced by:
- Batch merging efficiency (multiple transactions processed together)
- Data ingestion rate from source
- Storage performance and contention
- Concurrent writes across multiple tables sharing resources
Compare against data source metrics to distinguish between ingestion bottlenecks and system performance limitations.
WAL Row Throughput (rows/s)
This metric displays rows processed per second during transaction merges. While similar to transaction throughput, this metric helps identify:
- Data density variations within transactions
- Processing overhead for row-heavy transactions
- Resource utilization from row-level operations
- Impact of row complexity on merge performance
Use alongside transaction throughput to understand the relationship between transaction size and processing efficiency.
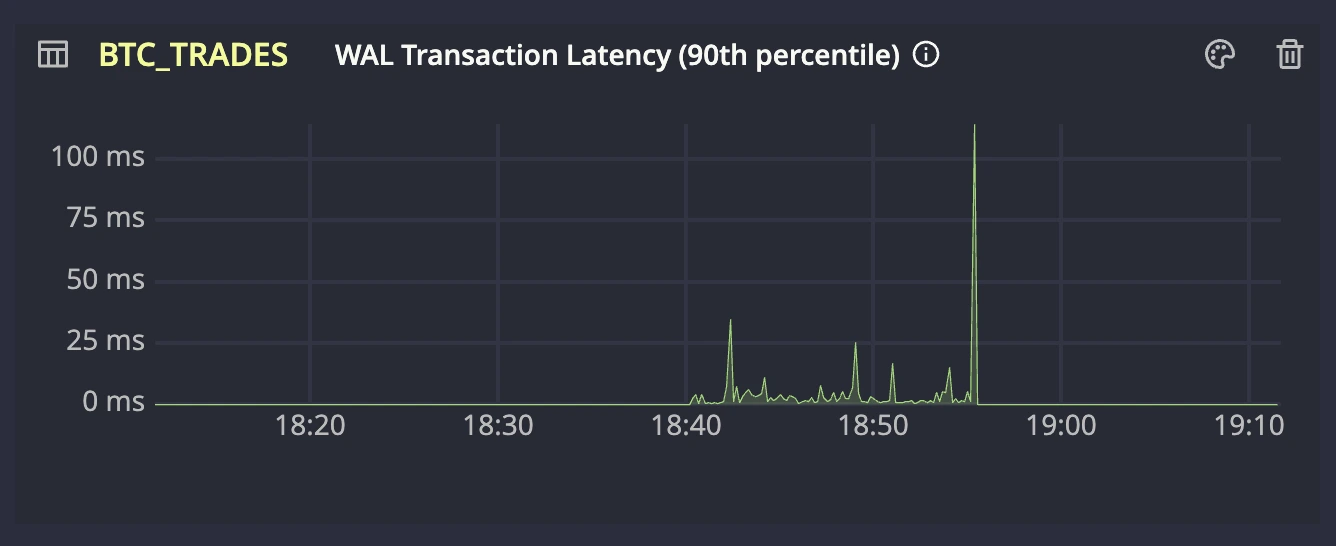
WAL Transaction Latency (90th percentile)
This metric indicates the time required for data to become readable after being written. Higher latency may stem from:
- Large transaction sizes (refer to Avg Transaction Size metric if elevated)
- Unordered data requiring additional processing
- Write amplification (see dedicated metric if batch size is optimal)
- Storage I/O limitations or contention
Monitor this metric alongside related charts to identify the root cause of performance variations and optimize accordingly.
Table Write Amplification
This metric tracks the data write overhead during merge operations. Write amplification occurs when:
- Copy-on-write operations affect large data blocks
- Datasets are re-ingested for deduplication
- Data requires extensive rewriting during merges
Scale ranges from optimal (1x) to problematic (1000x+). High amplification typically indicates duplicate data ingestion or suboptimal data ordering patterns.
Table Average Transaction Size (rows/txn)
This metric tracks the mean size of transactions processed through the database API. While the database is optimized for both small and large transactions, larger batch sizes generally lead to better database performance. Monitor this metric to understand your API's transaction patterns and identify opportunities for batch size optimization. Key aspects to observe:
- Transaction size trends and variations
- Any unusually small transactions that could be batched
- Consistency of batch sizes across time periods
Metrics View displays key metrics for quick monitoring in the Web Console. For comprehensive metrics and advanced monitoring capabilities, see Prometheus monitoring and alerting.
Best Practices
- Limit the number of active widgets to maintain performance
- Use appropriate time ranges (shorter ranges for real-time monitoring)
- Remove unused widgets to reduce resource consumption
- Historical data queries may transfer more data for longer time ranges
This comprehensive monitoring capability helps you maintain optimal database performance and identify issues before they impact your applications.