Crypto Data Visualization Dashboards with Grafana
This post comes from Tancrede Collard, who has written an excellent tutorial that shows how to use Python to fetch cryptocurrency data from Coinbase, store it in QuestDB, and visualize the data using Grafana. Thanks for the submission, Tancrede!
Visualizing time series data
When analyzing streaming data such as cryptocurrency or market metrics, the foundation of the data processing pipeline is efficient storage and queries. To use this data for insights and analytics, data visualization is a convenient way to plot and convey trends, create actionable reports, or even set up alerting.
Most cryptocurrency trading projects will focus on price charts and standard indicators like RSI or moving averages. Derivatives are often overlooked in many cryptocurrency analytics and visualization projects, and there's plenty to explore, such as the underlying pricing metrics such as volatility and funding rates.
A lot of common off-the-shelf tools can plot prices over time, but few are available for derivative features. Having control of the underlying database, creating custom metrics, and building dashboards based on these metrics allows us to build our own solutions with custom pricing inputs and models for derivatives.
In this tutorial, you'll learn how to fetch data from the Coinbase API using a Python script, load the data into QuestDB and run SQL queries via QuestDB for derivatives insights. We'll be visualizing data using Grafana so that we can build dashboards for reporting or alerts based on metrics you care about.
Prerequisites
To follow with this tutorial, you'll need the following:
Installing QuestDB using homebrew
Before we can start storing data, we'll need to get QuestDB up and running. Aside from running QuestDB from binaries and via Docker, macOS users can get started using homebrew:
brew install questdb
Additional settings can be changes in the
server configuration file located at
/opt/homebrew/var/questdb/conf/server.conf for the homebrew install. The
interface we'll be using for inserting data is ILP
(InfluxDB line protocol)
over TCP which runs on port 9009 by default. The server configuration for these
keys looks as follows:
######################### LINE TCP settings ###############################line.tcp.enabled=trueline.tcp.net.active.connection.limit=10line.tcp.net.bind.to=0.0.0.0:9009
To avoid unnecessary memory usage when using Grafana, it's recommended to
disable QuestDB's SELECT query cache with the following PostgreSQL property in
QuestDB's server config:
pg.select.cache.enabled=false
When we've set these server configuration properties, we can start up the database service with QuestDB's CLI:
questdb start
Fetching data from Coinbase using Python
Cryptocurrency data is readily available from a variety of public APIs. Coinbase offers a simple API endpoint to get an indicative bid and offer price which is all we need for our use case.
https://api.coinbase.com/v2/prices/
It requires an authorization token which you should obtain from your Coinbase account. For this tutorial, we'll use a simple Python script to periodically poll the endpoint for a given currency pair. The loop does 3 things:
- fetch SELL (bid) and BUY (ask) prices
- send the current bid & ask prices to QuestDB via ILP
- sleep 2 seconds before looping to step 1
The script uses requests for the HTTP requests to the Coinbase API and
socket for the direct TCP communication to QuestDB. Replace your_token by
the API key from your Coinbase account:
import requestsimport socketfrom time import sleep# QuestDB settingsHOST = 'localhost'PORT = 9009# Authtoken='your_token'# Request settingspair='BTC-USD'sellURL="https://api.coinbase.com/v2/prices/"+pair+"/sell"buyURL="https://api.coinbase.com/v2/prices/"+pair+"/buy"PARAMS={'Authorization': 'Bearer '+token}if __name__ == '__main__':try:while 1==1:# Get data from the APIsellData = requests.get(url=sellURL, params=PARAMS).json()buyData = requests.get(url=buyURL, params=PARAMS).json()sp = sellData['data']['amount']bp = buyData['data']['amount']# Send data to QuestDBsock = socket.socket(socket.AF_INET, socket.SOCK_STREAM)sock.connect((HOST, PORT))sock.sendall(('crypto,fromCCY=BTC,toCCY=USD,exch=CB bid='+sp+',ask='+bp+'\n').encode())sleep(2)except Exception as e:print(e)
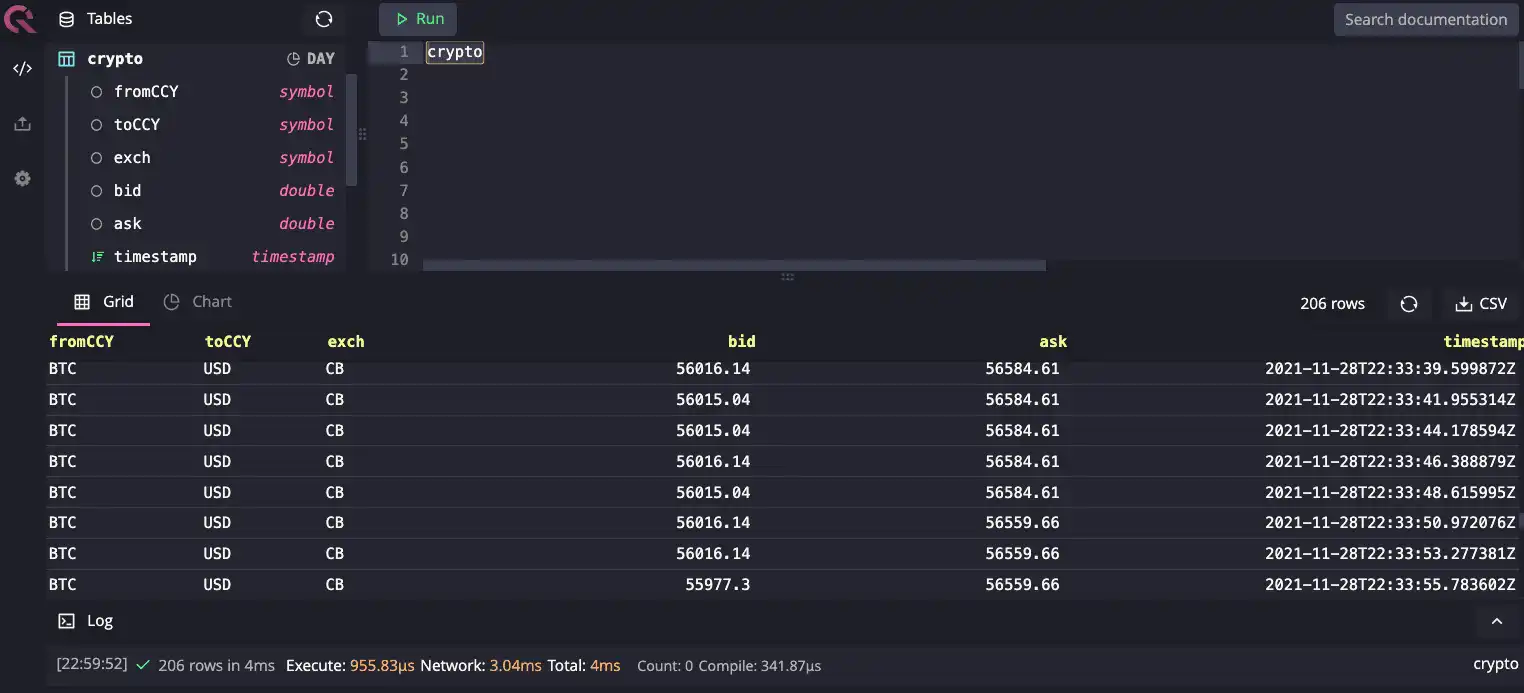
When you start the script, prices should appear in the
Web Console for QuestDB. Running crypto (this is
shorthand for SELECT * FROM crypto) in the SQL editor shows the prices flowing
in QuestDB:

One important thing to note is that we didn't create a table before sending
data. QuestDB automatically creates tables using the appropriate columns
detected from the message. The currency identifiers are inserted as
symbol types, and the values are
inserted as doubles. It's also noteworthy that the record timestamp is set as
the server time when the row was inserted and tables created from ILP ingestion
have a default day partitioning. The
schema looks like this:
fromCCY: symboltoCCY: symbolexch: symbolbid: doubleask: double
Building a Grafana dashboard
Grafana is an excellent tool for data visualization, and it comes in extremely handy If you're doing any algorithmic trading. The variety of integrations with other services enables you to quickly set up monitoring and alerts for conditions like irregular prices or flow and risk limits.
This tutorial is tailored for macOS users, so we'll use Homebrew, but there are other options covered in the QuestDB Grafana guide:
brew install grafanabrew services start grafana
To configure Grafana, open the UI available
http://localhost:3000 and configure QuestDB:
To connect Grafana with QuestDB and establish a data source, follow these steps:
- In Grafana, select Data Sources under the Connections tab on the left hand panel and click the Add data source button.
- Navigate to the bottom of the page and click Find more data source plugins. Search for QuestDB and click Install.
- Once the QuestDB data source for Grafana is finished installing, click on the blue Add new data source button where the Install button used to be.
Finally, configure it with the following settings:
Server address:localhostServer port: 8812Username:userPassword:questTLS/SSL mode:disable
Calculating indicative bid offers
Let's craft a query in Grafana that will allow us to plot the metrics we're
interested in. Start off by creating a new dashboard and click on new panel.
The pencil icon allows you to provide a query to run against QuestDB for Grafana
to plot:

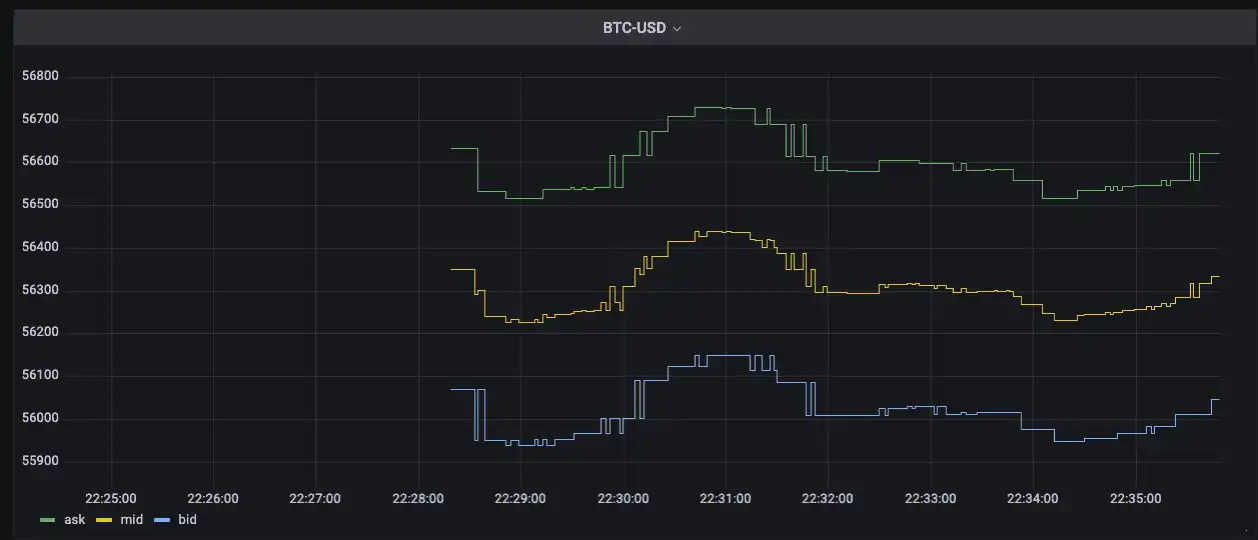
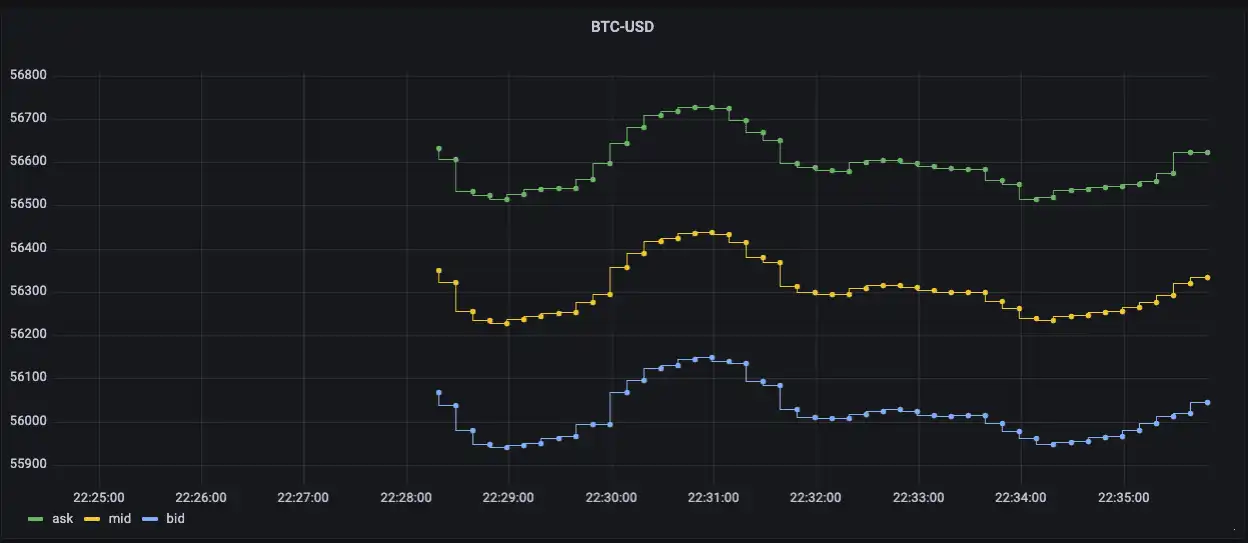
Paste the following query to create a time series of the bid-offer and mid price:
selecttimestamp as time,avg(ask) as ask,avg(ask+bid)/2 as mid,avg(bid) as bidfrom cryptowhere $__timeFilter(timestamp)and fromCCY='BTC' and toCCY='USD' and exch='CB'sample by $__interval
To simplify queries which have dynamic elements such as date ranges, the query contains global variables. We're using two:
$__timeFilter(timestamp)- allows filtering results by sending a start-time and end-time to QuestDB; generates aBETWEENclause.$__interval- calculates a dynamic interval based on the time range applied to the dashboard. By using this function, the sampling interval changes automatically as the user zooms in and out of the panel.
At this point, we have a dashboard with ticking prices. We can start experimenting with other parameters such as the colors or the sample frequency for each of the series. The Grafana UI can be used to change the chart range and resolution:


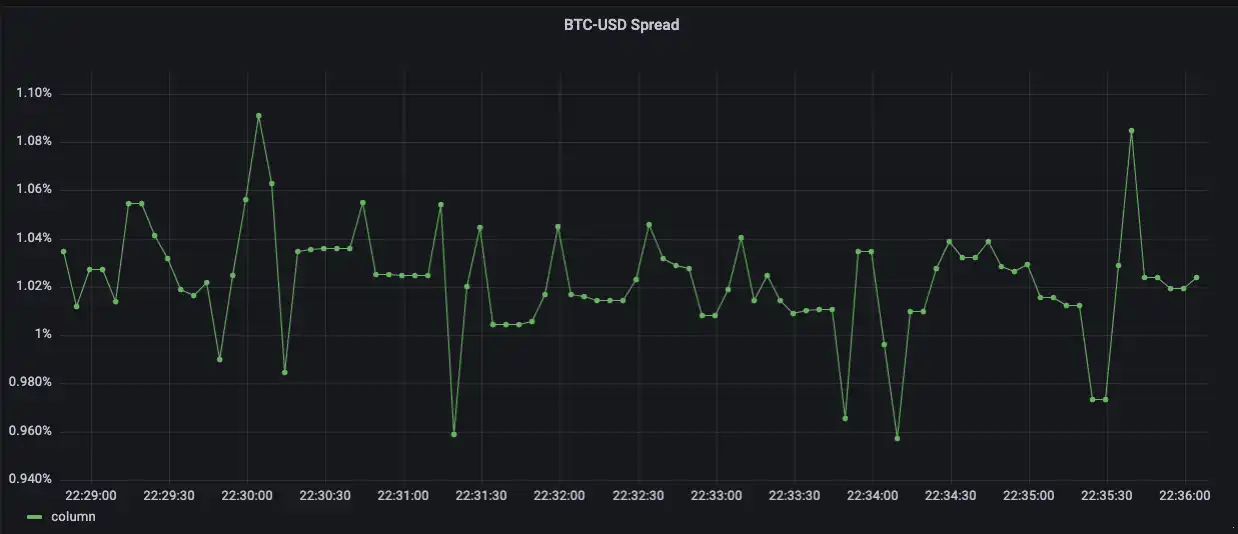
Although our data is very simplistic right now (indicative bid an offer from one platform on one pair), the nice thing about building this from scratch is that we can calculate derived metrics such as the spread over time:
selecttimestamp as time,avg(ask-bid)/(avg(bid+ask)/2)*100from cryptowhere $__timeFilter(timestamp)and fromCCY='BTC' and toCCY='USD' and exch='CB'sample by $__interval

Next steps
There are many other things to do, such as pulling prices from various venues or fetching order book data rather than indicative top-of-book. The next steps we can take with this project that would be interesting to explore would be:
- Deriving forward curve and implied funding on cryptocurrency using futures prices
- Plotting crypto volatility smiles
If you like this content, we'd love to know your thoughts! Feel free to share your feedback or just come and say hello in the community forums.