PowerBI
This guide demonstrates how to connect QuestDB with Microsoft PowerBI to create interactive data visualizations and dashboards.
Prerequisites
- QuestDB running locally or remotely
- PowerBI Desktop installed
Connection Setup
QuestDB utilizes a fully featured PostgreSQL Wire Protocol (PGWire). As such, setup for PowerBI mirrors the standard PostgreSQL connection setup. The benefit is the performance profile of QuestDB, and its powerful time-series SQL extensions, with the simplicity of the PGWire protocol.
-
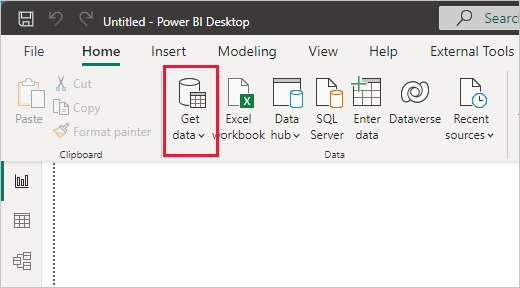
Open PowerBI Desktop
-
Click "Get Data" in the Home tab

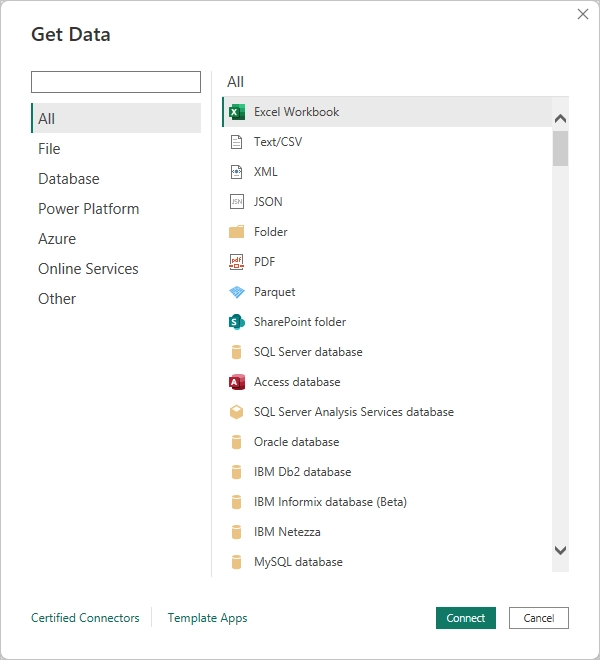
- Select "Database" → "PostgreSQL"

-
Enter your QuestDB connection details:
- Server:
localhost(or your server address) - Database:
qdb - Data Connectivity mode:
Import - Advanced options (optional):
- Port:
8812(default QuestDB PGWire port) - Command timeout: Adjust based on your query complexity
- Port:
- Server:
-
Select:
- Database authentication:
- User:
admin - Password:
quest
- User:
- Database authentication:
-
Click "Connect"
Working with Data
- In the Navigator window, select the tables you want to analyze
- Click "Transform Data" to modify the data or "Load" to import it directly
- Create visualizations by dragging fields onto the report canvas
- Save your report and publish it to PowerBI Service if needed
Using Custom SQL
To leverage QuestDB-specific features like SAMPLE BY and LATEST ON, you can use custom SQL:
- In the "Get Data" dialog, click "Advanced options"
- Enter your SQL query in the "SQL statement" field
- Click "OK" to execute
Remember, you must include a timestamp column when using functions like
SAMPLE BY.
Here are some useful query examples:
-- Get 1-hour samples of trade prices
SELECT
    timestamp,
    avg(price) as avg_price,
    sum(amount) as volume
FROM trades
WHERE timestamp >= dateadd('d', -7, now())
SAMPLE BY 1h;

-- Get latest trade for each symbol
SELECT * FROM trades
LATEST ON timestamp PARTITION BY symbol;

-- Combine SAMPLE BY with multiple aggregations
SELECT
    timestamp,
    symbol,
    max(price) max_price,
    min(price) min_price,
    avg(price) avg_price
FROM trades
WHERE timestamp >= dateadd('M', -1, now())
SAMPLE BY 1d
ALIGN TO CALENDAR;
Best Practices
- Leverage timestamps functions for time-series analysis
- Explore various aggregation functions to suit your data needs
- Consider using powerful window functions to perform complex calculations
- For large datasets, use incremental refresh in PowerBI
Caveats
Date Table Limitations
QuestDB currently cannot be used as a source for PowerBI's "Mark as Date Table" feature. This means:
- You cannot mark QuestDB tables as date tables in PowerBI
- Some time intelligence functions in PowerBI may not be available
- If you need date table functionality, consider creating it in PowerBI or using another data source
If you'd like QuestDB to support this feature, please add a 👍 to this GitHub issue.
Troubleshooting
- If connection fails, verify your QuestDB instance is running and accessible
- Ensure PGWire is enabled in your QuestDB configuration
pg.enabled=true- see configuration for more details
- Check that the port
8812is open and not blocked by firewalls - For timeout errors, adjust the command timeout in advanced options