Profiling
Profiling lets you see what's happening inside the database at the code level - which functions are consuming CPU time, where memory is being allocated, and what's blocking threads. This is an advanced diagnostic technique. Most users will never need it; query plans, metrics, and logs are usually sufficient for understanding performance.
However, when you're facing issues that can't be explained by the usual tools - unexplained CPU spikes, mysterious latency, or behavior that doesn't match what metrics suggest - profiling reveals the internal picture.
QuestDB embeds async-profiler in the Linux x86_64 distribution, with convenience commands built into questdb.sh.
There are two profiling approaches:
-
Ad-hoc profiling produces a single flame graph for a specific time window. Use this when you can reproduce an issue on demand - start profiling, trigger the problem, stop profiling, and analyze the result.
-
Continuous profiling records to JFR files in the background, which can later be converted to heatmaps. Heatmaps show activity over time, letting you spot anomalies and zoom into specific moments to generate flame graphs. Use this when problems occur unpredictably - the profiler is always running, so you can investigate after the fact.
This page covers:
- Ad-hoc profiling - Attach to a running instance and capture a flame graph
- Continuous profiling - Run the profiler in the background for later analysis
Prerequisites
Profiling requires async-profiler. QuestDB ships with async-profiler and the jfrconv converter bundled in the Linux x86_64 distribution only. For other platforms, you must install async-profiler separately.
Linux kernel settings
Profiling works without any kernel configuration changes, but for best accuracy on Linux, configure the following kernel parameters:
# Allow unrestricted access to perf events
sudo sysctl kernel.perf_event_paranoid=-1

# Expose kernel symbols for complete stack traces
sudo sysctl kernel.kptr_restrict=0
To make these settings permanent, add them to /etc/sysctl.conf or create a file in /etc/sysctl.d/:
# /etc/sysctl.d/99-profiling.conf
kernel.perf_event_paranoid=-1
kernel.kptr_restrict=0
| Setting | Recommended Value | Description |
|---|---|---|
perf_event_paranoid | -1 | Controls access to performance events. Value -1 allows unrestricted access to perf events, providing the most accurate profiling results. |
kptr_restrict | 0 | Controls kernel pointer visibility. Value 0 exposes kernel symbols, enabling complete stack traces including kernel frames. |
Without these settings, profiling still works but may have reduced accuracy.
These settings have security implications as they expose performance counters and kernel addresses. On production systems, consider enabling them only during profiling sessions, or use more restrictive values based on your security requirements. See the Linux kernel perf security documentation for details.
Attach to a running instance
Use the profile command to attach async-profiler to an already running QuestDB instance. This mode is useful for ad-hoc profiling of production systems without requiring a restart.
Syntax
./questdb.sh profile [-t tag] -- [profiler-args]
| Option | Description |
|---|---|
-t | Process tag to identify which QuestDB instance to profile. Required only when profiling an instance started with a custom -t tag. |
-- | Separator between questdb.sh options and async-profiler arguments. |
All arguments after -- are passed directly to the asprof command-line tool.
Examples
Profile CPU usage for 30 seconds and generate an HTML flame graph:
./questdb.sh profile -- -e cpu -d 30 -f /tmp/cpu-profile.html
Profile memory allocations:
./questdb.sh profile -- -e alloc -d 60 -f /tmp/alloc-profile.html
Profile lock contention:
./questdb.sh profile -- -e lock -d 30 -f /tmp/lock-profile.html
Generate a JFR (Java Flight Recorder) file instead of HTML:
./questdb.sh profile -- -e cpu -d 60 -f /tmp/profile.jfr
Profile a specific tagged instance:
./questdb.sh profile -t mydb -- -e cpu -d 30 -f /tmp/profile.html
Common profiler arguments
| Argument | Description |
|---|---|
-e <event> | Event to profile: cpu, alloc, lock, wall, itimer, etc. |
-d <seconds> | Duration of profiling in seconds. |
-f <file> | Output file. Extension determines format: .html for flame graph, .jfr for JFR, .svg for SVG. |
-i <interval> | Sampling interval (e.g., 10ms, 1us). |
-t | Profile threads separately. Each stack trace will end with a frame that denotes a single thread. (Note: this is asprof's -t, distinct from the questdb.sh -t tag option used before --.) |
--all-user | Include only user-mode events. |
For a complete list of options, see the async-profiler documentation.
Continuous profiling
Overview
Use the -p flag with the start command to run the profiler continuously in the background. This is valuable when you don't know when a problem will occur - the profiler is always recording, so you can analyze what happened after the fact. Continuous profiling helps catch rare events that are difficult to reproduce and reveals patterns and trends over time.
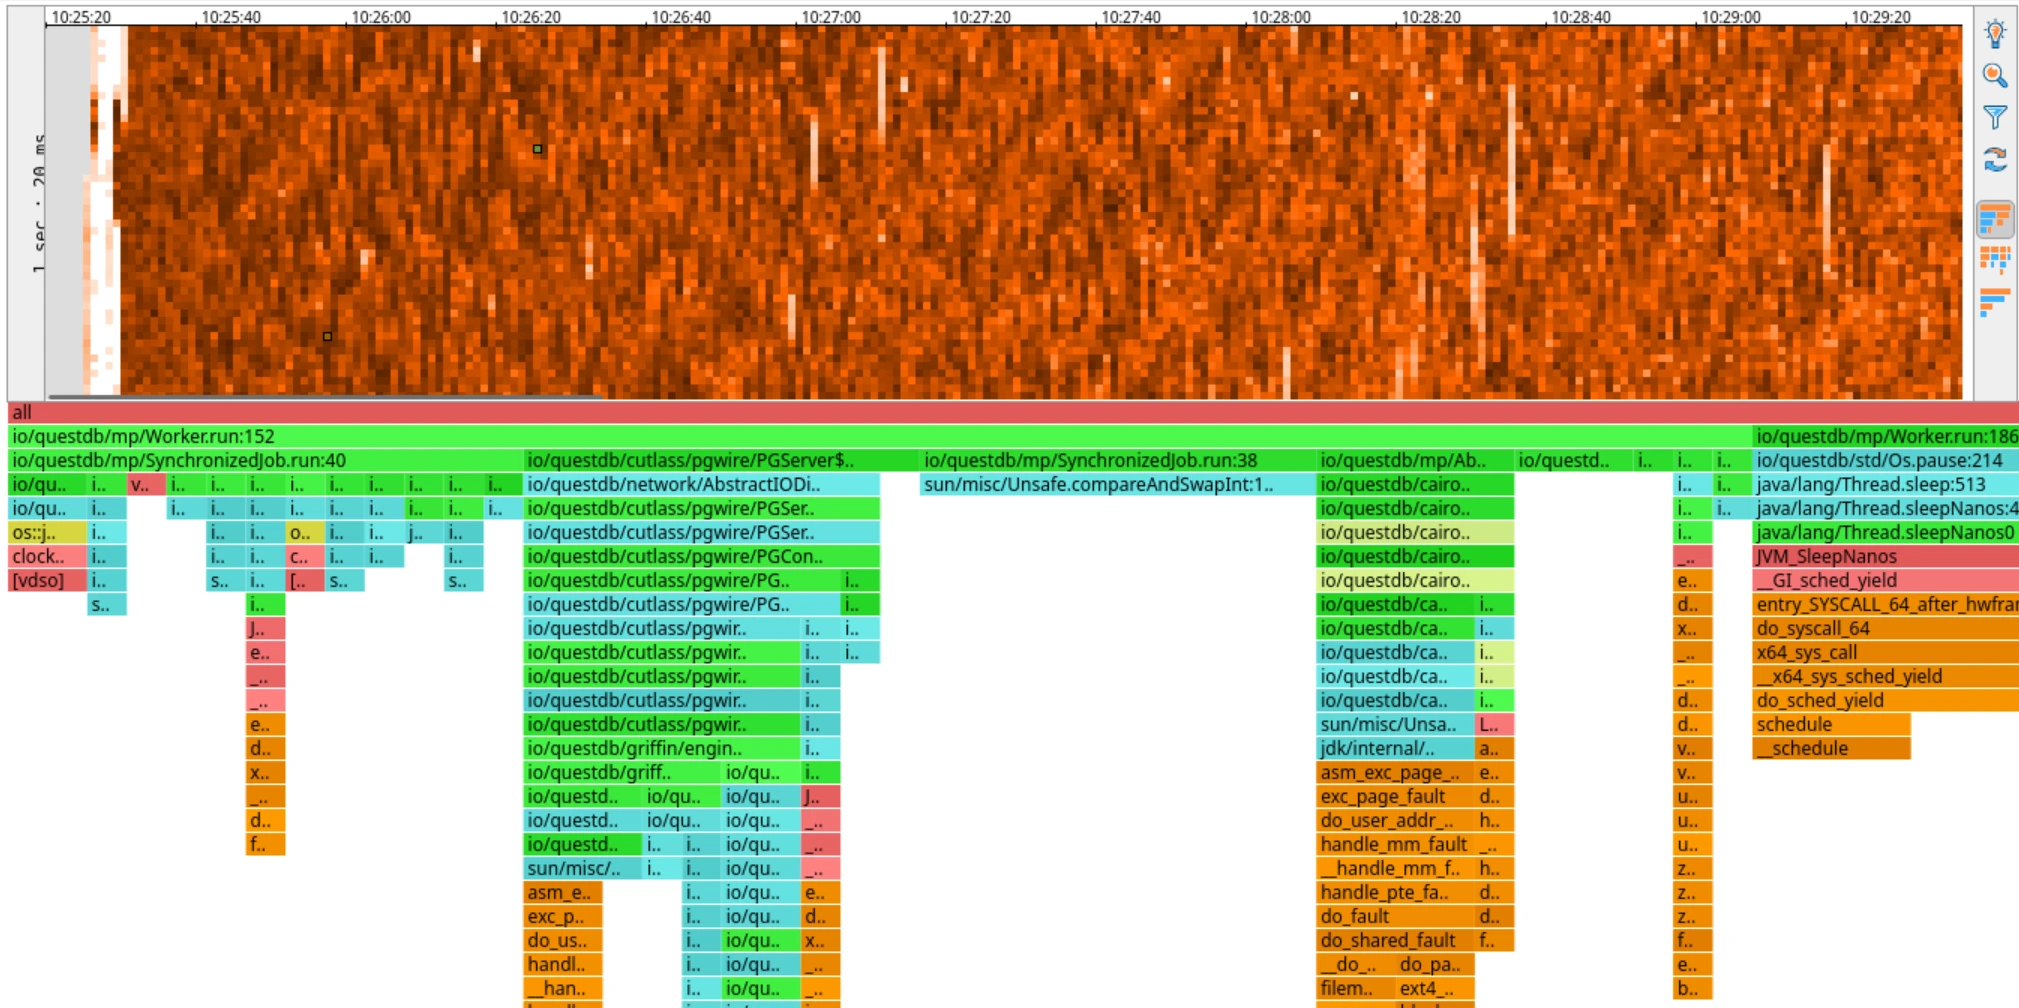
Profile data is written to JFR files in the <QDB_ROOT>/profiles directory (e.g., ~/.questdb/profiles/). These can later be converted to heatmaps. Heatmaps show samples over time, letting you spot anomalies and then zoom into a specific time window to generate a flame graph for just that period.
Default configuration
When you run ./questdb.sh start -p without additional parameters, the profiler uses these defaults:
| Setting | Default | Description |
|---|---|---|
| Events | cpu,wall | Profiles both CPU time and wall-clock time simultaneously |
| Interval | 5ms | Sampling interval for CPU and wall-clock profiling |
| Allocation interval | 512k | Sample every 512 KB of allocations (when alloc event is enabled) |
| Lock threshold | 10ms | Sample locks held longer than 10ms (when lock event is enabled) |
| Loop duration | 30m | Start a new JFR file every 30 minutes |
| Output directory | <QDB_ROOT>/profiles | Profile files are written here |
| File name pattern | profile-%n{48}.jfr | Sequence number up to 48, then wraps around |
With the default 30-minute loop and sequence limit of 48, the profiler keeps up to 24 hours of data before overwriting. JFR file sizes depend on workload activity - expect roughly 10-50 MB per 30-minute file under typical load. Monitor disk usage if running continuously in production.
Override defaults via environment variables before starting QuestDB:
export PROFILER_EVENT="cpu"           # Profile CPU only
export PROFILER_INTERVAL="10ms"       # Less frequent sampling
export PROFILER_LOOP="1h"             # New file every hour
./questdb.sh start -p
If you pass custom agent parameters after --, they replace the environment variable defaults entirely.
Syntax
./questdb.sh start -p [-d dir] [-f] [-n] [-t tag] [-- agent-params]
| Option | Description |
|---|---|
-p | Enable async-profiler agent at startup. |
-d | QuestDB root directory. |
-f | Force overwrite of the public (Web Console) directory. |
-n | Disable HUP signal handler (keeps QuestDB running after terminal closes). |
-t | Process tag for identification. |
-- | Separator between questdb.sh options and JVM agent parameters. |
Arguments after -- are passed as JVM agent parameters to async-profiler.
Examples
Start with default settings (profiles cpu,wall events, writes to <QDB_ROOT>/profiles/):
./questdb.sh start -p
Start with custom parameters (overrides all defaults):
./questdb.sh start -p -- start,event=cpu,file=/tmp/profile.jfr,interval=10ms
Start with wall-clock profiling at a custom interval:
./questdb.sh start -p -- start,event=wall,file=/tmp/wall.jfr,interval=20ms
Agent parameters
When using continuous profiling, parameters are passed in a comma-separated format:
| Parameter | Description |
|---|---|
start | Begin profiling immediately on JVM startup. |
event=<type> | Event type to profile: cpu, alloc, lock, wall, etc. |
file=<path> | Output file path. |
interval=<time> | Sampling interval (e.g., 10ms, 1us). |
jfr | Force JFR output format. |
collapsed | Output in collapsed stack format (for custom flame graphs). |
Interpreting results
Interpreting profiling results is a non-trivial exercise. Flame graphs and heatmaps can be misleading without context about what's normal for your workload. If you're unsure what you're seeing, share your profile on the QuestDB Community Slack - the team and community are happy to help.
HTML flame graphs
HTML flame graphs provide an interactive visualization of the call stack:
- Width of each box represents the proportion of time spent in that function
- Color typically indicates the type of code (Java, native, kernel)
- Click on a box to zoom in on that portion of the stack
- Search functionality helps locate specific methods
JFR files
Use jfrconv (bundled in QuestDB's lib directory) to convert JFR files to flame graphs or heatmaps. The interactive HTML output is easier to navigate than GUI tools like JDK Mission Control.
Convert to a flame graph:
./lib/jfrconv profile.jfr profile.html
Convert to a heatmap:
./lib/jfrconv -o heatmap profile.jfr profile-heatmap.html
For continuous profiling data, start with the heatmap. It shows samples over time, making it easy to spot anomalies. Click and drag to select a time range and the flame graph updates instantly to show only that period.
Common profiling scenarios
Diagnosing high CPU usage
Profile CPU to identify hot methods:
./questdb.sh profile -- -e cpu -d 60 -f /tmp/cpu.html
Look for wide boxes at the top of the flame graph, which indicate methods consuming the most CPU time.
Investigating slow queries
Use wall-clock profiling to capture time spent waiting (I/O, locks, etc.):
./questdb.sh profile -- -e wall -d 30 -f /tmp/wall.html
Memory allocation analysis
Profile allocations to find memory-intensive operations:
./questdb.sh profile -- -e alloc -d 60 -f /tmp/alloc.html
Lock contention
Identify synchronization bottlenecks:
./questdb.sh profile -- -e lock -d 30 -f /tmp/lock.html
Troubleshooting
Profiler fails to attach
If the profiler cannot attach to a running instance:
- Verify QuestDB is running:
./questdb.sh status - Check that you're using the correct tag if running multiple instances
- Ensure you have sufficient permissions (may require running as the same user)
Missing symbols in flame graph
If the flame graph shows [unknown] frames:
- Ensure debug symbols are available for native libraries
- Try different C stack walking modes with
--cstack:fp(frame pointer),dwarf,lbr(Last Branch Record), orvm/vmx(HotSpot VM structs) - Use the
--all-userflag to exclude kernel frames if not needed
High overhead
If profiling causes noticeable performance impact:
- Increase the sampling interval:
-i 20msinstead of the default - Profile for shorter durations
- Use CPU profiling instead of allocation profiling for lower overhead
See also
- Logging and metrics - Configure logging and Prometheus metrics
- Monitoring and alerting - Set up health checks and alerts
- Design for performance - Performance optimization guidelines